

By James Picerno | The Milwaukee Company
Rising Treasury yields are increasing competition for stocks and raising the market’s hurdle rate
Investors seem to remain focused on strong earnings growth, with AI viewed as a key driver of future profits
Elevated equity-market valuations and high expectations for earnings growth leave the market with little room for negative surprises
The U.S. stock market has remained resilient this year despite a series of headwinds. More recently, rising interest rates and renewed inflation concerns have come to the forefront, setting the stage for another test of the bull market’s durability.
The U.S. 10-year Treasury yield is trading at 5.24%, the highest level since 2007, increasing the relative attractiveness of bonds and potentially drawing capital away from equities at the margin. So far, however, the stock market has remained steady, trading in a relatively tight range over the past two months and holding near a record high, based on the S&P 500 Index.
Stock market optimists remain focused on the economy’s resilience, the prospect that inflation will stay contained enough to prevent a sustained rise in interest rates, and continued growth in corporate profits. They also see artificial intelligence as a powerful long-term catalyst for growth, arguing that AI-driven gains in productivity, efficiency, and new revenue opportunities could drive earnings higher and help justify elevated equity valuations despite a more challenging interest-rate environment.
FactSet provides support for the optimists in its latest analysis of the outlook for corporate earnings: “For Q3 2026, the estimated (year-over-year) earnings growth rate for the S&P 500 is 29.1%. If 29.1% is the actual growth rate for the quarter, it will mark the third-straight quarter of earnings growth above 25% for the index.”
The market appears to be pricing in a near-best-case scenario. If so, the margin for disappointment may be slim. Consider, for instance, the rolling 10-year annualized return for the S&P 500, which is roughly 13.6%, based on month-end data. That’s close to the strongest reading in decades. Although strong performance can persist for extended periods, the stock market’s cyclical history suggests that vulnerability to disappointment may be higher than usual.
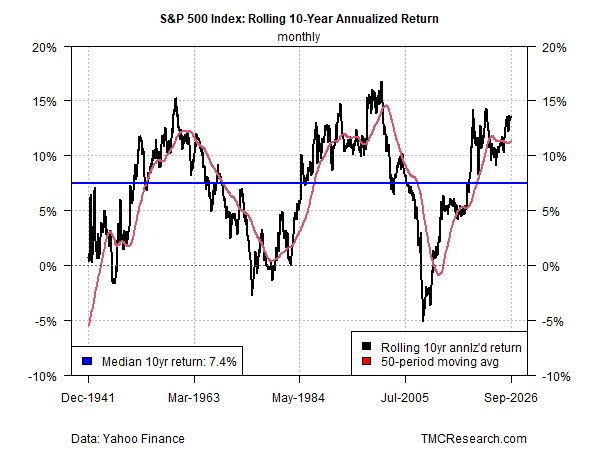
The list of potential trouble spots for market sentiment is lengthy, ranging from the possibility of weaker-than-expected earnings results to inflation that proves hotter and more persistent than currently expected, prompting the Federal Reserve to continue raising interest rates.
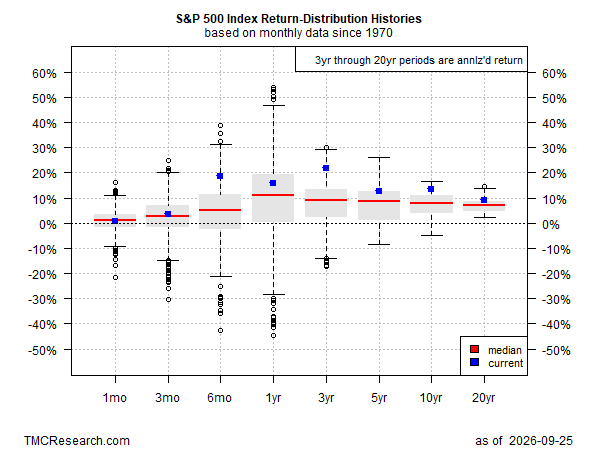
For another perspective on the stock market’s sensitivity to adverse developments, consider current trailing performance across a range of investment horizons. As the chart below highlights, the S&P 500’s current return is well above the historical “normal” range for most rolling periods since 1970.
TMC Research's current estimate of a 5.6% annualized return for the S&P 500 over the next 10 years remains well below the market's trailing 10-year performance, based on the average forecast from five models (defined below).
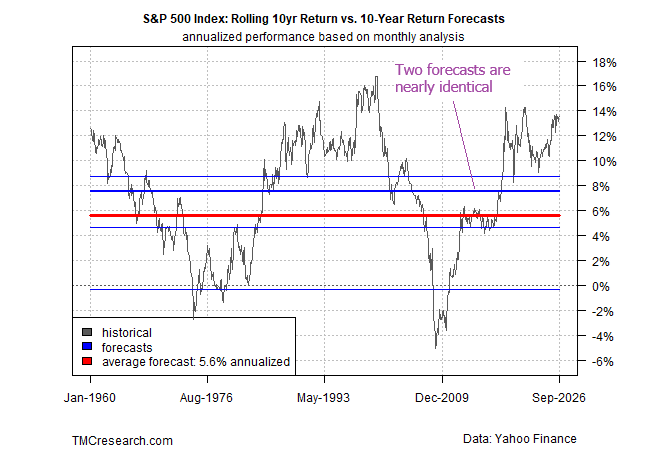
Our current 10-year market forecast is unchanged from the previous estimate in July. The S&P 500 has moved modestly higher since that update.
None of this necessarily implies that the current bull market is nearing an end. Momentum, strong earnings growth, and enthusiasm surrounding artificial intelligence could continue to support equities. But with valuations elevated, Treasury yields near multi-year highs, and investor expectations broadly optimistic, the balance of risks appears somewhat less favorable than it has been in recent years. As a result, future returns may depend less on expanding valuations and more on the market’s ability to deliver the robust earnings growth that investors currently expect.
With so much good news already reflected in prices, merely meeting expectations may no longer be enough. Beating them may be required at this stage. Even modest disappointments could prove more consequential than usual given current valuations.
A related risk factor that could play a role in raising market sensitivity to weaker-than-expecting earnings news: valuations are already near historically elevated levels. The Shiller P-E Ratio, for example, is currently 41, just below its peak of 44 in late 1999, which marked the highest reading in the indicator’s history dating to the late-19th century.
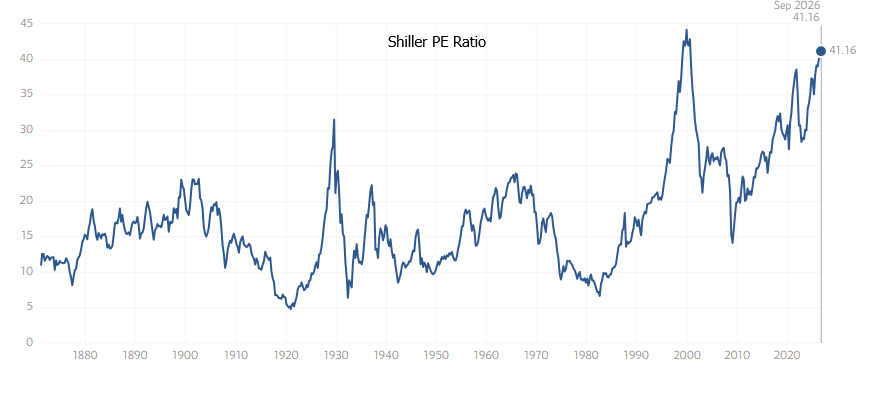
In a market priced for exceptional outcomes, anything less than exceptional may be a problem.
Here’s a quick review of each of the five models used to generate the average forecast above:
CAPE Ratio Model: this stock market valuation indicator, maintained by Professor Robert Shiller, is calculated using real earnings per share for the S&P 500 based on a rolling 10-year window. TMC Research uses the CAPE ratio to generate an implied return for the stock market.
Earnings Yield Model: the stock market’s implied ex ante performance is derived from the S&P 500’s earning yield, defined as the inverse of the price-to-earnings ratio.
ARIMA Model: In contrast with the two models above, which use valuation to infer future return, this estimate uses statistical analysis to generate a forecast. An autoregressive integrated moving average (ARIMA) model is a type of regression analysis that’s run on rolling window of the market’s return history to estimate future results.
Bayesian Model: This statistical model uses lags as a basis for updating so-called “prior beliefs” on a rolling basis to estimate the effects of previous effects on the S&P 500 to forecast return.
Average Historical Return Model: This naïve estimate is a simple average of all the rolling 10-year returns since 1960.
