

By James Picerno | The Milwaukee Company
Lofty stock market valuations leave little room for error if AI earnings don’t keep delivering
The S&P 500’s AI tailwind is strong, but the headwinds may be getting stronger
AI is still powering the S&P 500, but China’s fast‑moving challengers are tightening the competitive screws
The US stock market has been on a wild ride this year, but the Middle East conflict has yet to dent bullish expectations. A key reason: enthusiasm for artificial intelligence (AI) as a business model. Wall Street projects this tech story will lift earnings at a robust rate well into the future.
The combination of AI‑related infrastructure spending and opportunities for selling AI services to businesses and consumers has fueled expectations that this leading edge of technology development will continue to drive corporate bottom lines to new heights in the near term.
FactSet estimates that that year-over-year earnings growth for S&P 500 companies will rise more than 23% in Q2, which would mark a second-straight quarter of growth at a 20%-plus pace. The forecast also reflects a strong improvement over the roughly 15% earnings growth that was expected when the year began, according to LSEG IBES data.
Despite Wall Street’s cheery outlook, the bull run isn’t without risk. One is the burgeoning threat of Chinese AI firms, which are charging far less than their American competitors. Models maintained by leading US firms, such as Anthropic and OpenAI, reportedly have an edge over systems offered by companies in China, but the gap is expected to narrow. Meantime, demand for China‑based systems is starting to gain traction. That persuades some analysts to argue that it’s just a matter of time before competitive pressures accelerate and potentially create stronger headwinds for AI‑driven earnings growth in the US.

Some analysts are beginning to question whether cash‑flow and earnings forecasts based on AI are too optimistic, given the rise of China‑based competition. Although no one can confidently predict how this business war will evolve, it’s clear that the crucial engine of optimism for the S&P 500 is increasingly bound up with assumptions that AI will do the heavy lifting to keep the earnings train rolling.
Buoyant earnings forecasts that hit the mark may become increasingly necessary at a time of elevated market valuations, which reflect assumptions that a best‑case scenario will prevail. A widely followed measure of price multiples for stocks is close to a record high. The Cyclically Adjusted PE Ratio (CAPE Ratio) is estimated at nearly 42 for July, near the 150‑year peak set during the dot‑com bubble in 1999–2000.
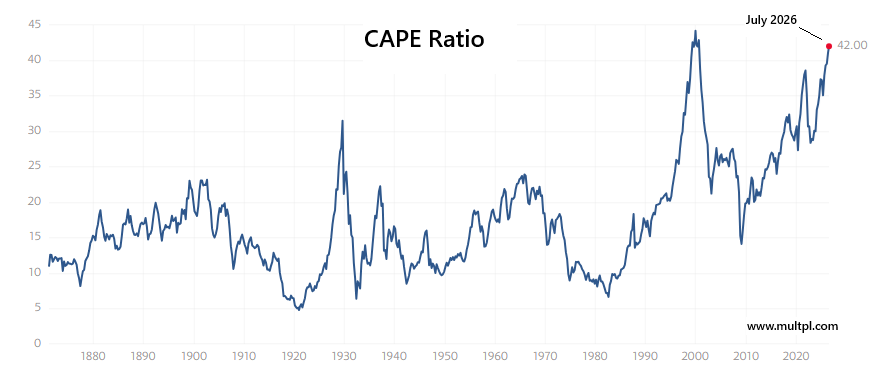
The pushback is that AI is generating earnings, whereas the tech bubble of a quarter century ago was largely driven by expectations—many of which failed to materialize in a timely manner. Fair point. But if the market is fully valued, if not excessively so (as some pundits argue), which implies relatively low expected returns, there’s little wiggle room for disappointment.
On that note, our update of expected return for the S&P 500 for the ten years ahead remains modest. In particular, the TMC Research average estimate for several models is a 5.6% annualized return for stocks – unchanged from our previous update in February, and still far below the market’s current trailing 13%-plus annualized rise over the past decade. As the chart below reminds, performance on a rolling ten-year basis has rarely been stronger.
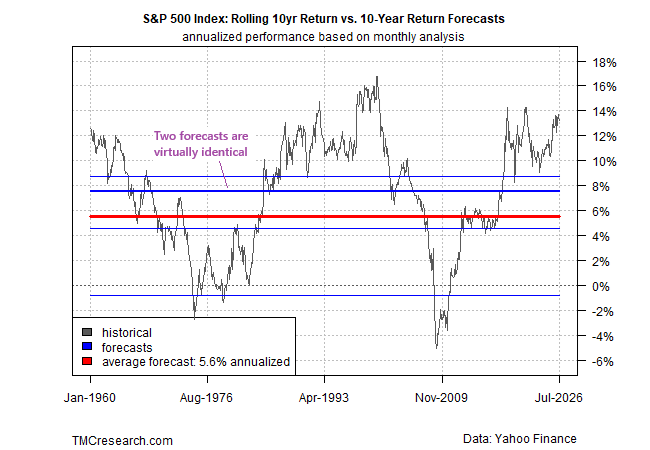
As always, the standard caveat applies when attempting to divine the future. Accordingly, take this and all forecasts with a grain of salt. However, the hefty gap between expected and actual performance suggests things might soon snap back to reality in some degree. It all comes down to the classic question: Is it really different this time? If so, why?
The future isn’t bound by the past, and perhaps AI is a genuine game-changer. But with the market outperforming so dramatically, the burden of proof is increasingly on the bulls to explain and rationalize why high returns and stellar earnings reports will persist.
Here’s a quick review of each of the five models used to generate the forecasts above:
CAPE Ratio Model: this stock market valuation indicator, maintained by Professor Robert Shiller, is calculated using real earnings per share for the S&P 500 based on a rolling 10-year window. TMC Research uses the CAPE ratio to generate an implied return for the stock market.
Earnings Yield Model: the stock market’s implied ex ante performance is derived from the S&P 500’s earning yield, defined as the inverse of the price-to-earnings ratio.
ARIMA Model: In contrast with the two models above, which use valuation to infer future return, this estimate uses statistical analysis to generate a forecast. An autoregressive integrated moving average (ARIMA) model is a type of regression analysis that’s run on rolling window of the market’s return history to estimate future results.
Bayesian Model: This statistical model uses lags as a basis for updating so-called “prior beliefs” on a rolling basis to estimate the effects of previous effects on the S&P 500 to forecast return.
Average Historical Return Model: This naïve estimate is a simple average of all the rolling 10-year returns since 1960.
