

By James Picerno | The Milwaukee Company
The CAPE Ratio suggests stocks remain richly valued, which may weigh on future returns and leave the market more vulnerable to corrections
A performance-based measure, however, indicates that investor enthusiasm remains below levels historically associated with extreme speculative excess
Taken together, the signals suggest a market that appears expensive by historical standards, but not unusually euphoric.
A lot has changed in financial markets and the economy over the past six months, but our Excess Return Oscillator (ERO) for the S&P 500 Index continues to tell a broadly similar story. Despite a rebound in equity prices since the April low, shifting expectations for Federal Reserve policy, and ongoing debate over the outlook for growth and inflation, the ERO remains in the neutral zone and close to the level that prevailed when we last reviewed the indicator in late April.
Although stocks appear richly valued by measures such as the Shiller Cyclically Adjusted Price-Earnings (CAPE) Ratio, there’s a case for arguing that speculative excess hasn’t surged. While elevated valuations may leave equities more vulnerable to bouts of volatility or correction, the ERO suggests that market sentiment has yet to reach the degree of irrational exuberance that has sometimes accompanied major market peaks in the past.
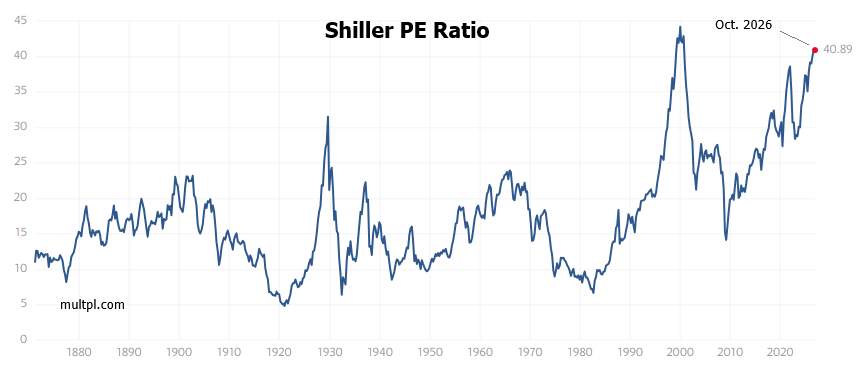
Valuation is not a single concept, and different measures can paint very different pictures of market risk. The current environment is a good example. Traditional metrics such as the CAPE Ratio continue to indicate that U.S. equities are trading at historically elevated valuations. From that perspective, future S&P 500 returns may be constrained, and the market could remain vulnerable to periodic corrections and extended stretches of below-average performance.
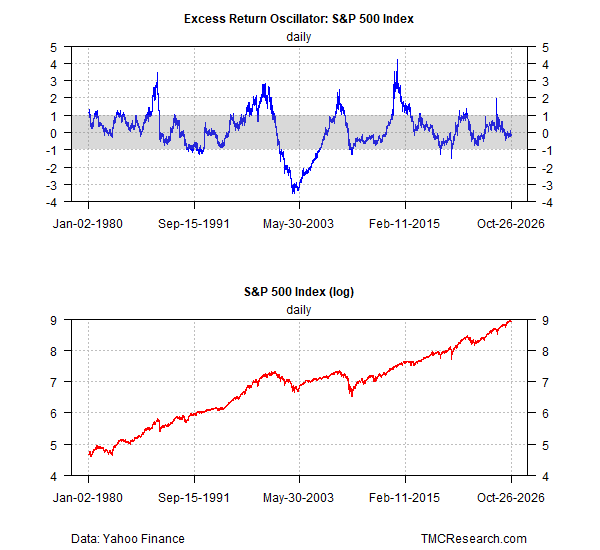
TMC Research’s ERO offers a different perspective. Rather than focusing solely on valuation, the indicator evaluates market performance relative to longer-term trends. Specifically, ERO compares the S&P 500’s rolling five-year return with its rolling five-year median and expresses the result as a z-score, indicating how many standard deviations returns are above or below their historical average.
Despite the strong rebound in share prices since April and improving sentiment about the economic outlook, ERO remains within its neutral range, as shown by the gray zone in the top chart above—essentially unchanged from April’s update. Although CAPE and similar metrics suggest that equities continue to trade at elevated valuations, ERO indicates that investor enthusiasm remains below levels that have historically been associated with the most speculative market environments. From that perspective, the indicator points to a market that may be fully valued, but not necessarily one characterized by the degree of optimism that has often preceded major market tops.
A possible reason that ERO is not signaling speculative excess is that investors continue to tie elevated valuations to expectations for stronger earnings growth, particularly from the optimism tied to the adoption of artificial intelligence (AI). To the extent that stock prices are being supported by anticipated improvements in profitability rather than purely by investor enthusiasm, the market may appear expensive without exhibiting the hallmarks of a speculative mania.
Regardless of the reasons, the divergence between the two indicators largely reflects what each is designed to measure. CAPE evaluates valuation through the lens of fundamentals, comparing current prices with a decade of inflation-adjusted earnings. By that measure, today’s market appears expensive relative to history. ERO, by contrast, measures the extent to which market performance has diverged from its longer-term trend.
In effect, CAPE asks whether stocks are richly priced relative to earnings, while ERO asks whether investor enthusiasm has pushed returns to unusually elevated levels in relative terms vs. history.
Neither measure should be viewed as a timing tool, and both have notable limitations when forecasting short-term market movements. Even so, ERO’s historical record suggests that it can provide useful context for evaluating sentiment-related risks. Periods in which the indicator has approached or exceeded a reading of +1 have sometimes coincided with unusually optimistic market environments and, in some cases, have been followed by significant market peaks.
The fact that ERO remains comfortably below that threshold today suggests that, despite elevated valuations and the possibility of more modest returns going forward, market psychology may not yet have reached the speculative extremes seen at some previous market highs.
For investors, the takeaway is less a warning of imminent danger and more a reminder that elevated valuations and subdued speculative sentiment can coexist for extended periods. In such an environment, maintaining realistic return expectations, focusing on rebalancing asset allocation weights, and monitoring changes in investor behavior may be more informative than attempting to anticipate the timing of the next major market turning point.
