
Stocks Still Overvalued Based on CAPE Ratio, But Broader Context Allows for Debate

By James Picerno | The Milwaukee Company
CAPE signals elevated valuation for the stock market, but a shorter-term measure suggests conditions remain “normal”
Divergent signaling reflects differing methodologies and limits of single‑metric views
Current conditions imply that traditional valuation measures may not be the main driver of near-term market risk
Stock market corrections may look similar from a top-down perspective of falling prices, but different factors can trigger corrections and bear markets at different times. High market valuation is a possible warning lately, but a markets‑based estimate suggests risk is lower than an accounting-based review of equities indicates.
There are multiple ways to measure valuation for stocks, and so conflicting signals are possible—if not likely—at times. Current conditions highlight the divergence. Consider the Shiller PE Ratio, a widely followed measure of market valuation. The Cyclically Adjusted Price‑Earnings Ratio (CAPE) is lofty and close to its highest level in decades, based on the April estimate from Professor Robert Shiller’s data. On that basis, stocks look substantially overvalued.
By contrast, TMC Research’s Excess Return Oscillator (ERO) for the S&P 500 suggests that the market remains in a “normal” range, as indicated by the gray zone in the top chart below. (Our previous ERO update was published in January.)
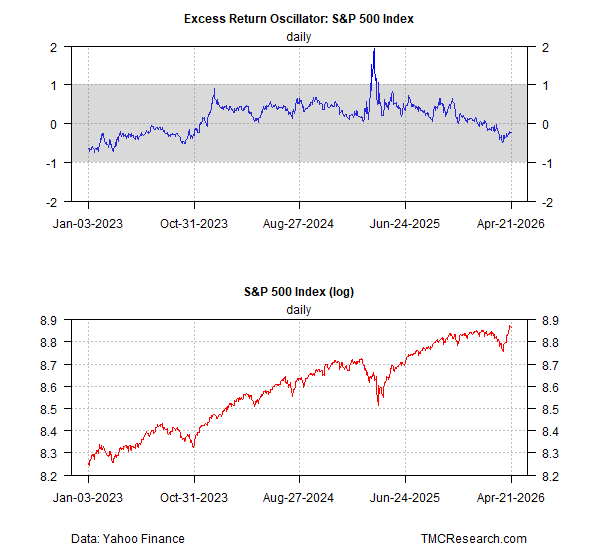
The sharp difference between the two indicators can be explained by methodology. Whereas CAPE reflects the S&P 500’s price relative to the average of real (inflation‑adjusted) earnings over a rolling 10‑year window, ERO compares the S&P’s rolling 5‑year return to its rolling 5‑year median, with results reframed as z‑scores indicating how many standard deviations returns are above or below the average on a rolling 5‑year basis.
Each valuation estimate has a distinct set of pros and cons, although both share the standard caveat that neither metric can reliably predict the market’s future performance, especially in the short term. That said, ERO’s long‑term history suggests that when the indicator moves toward or exceeds a +1 reading, the odds rise for a relatively significant near‑term top.
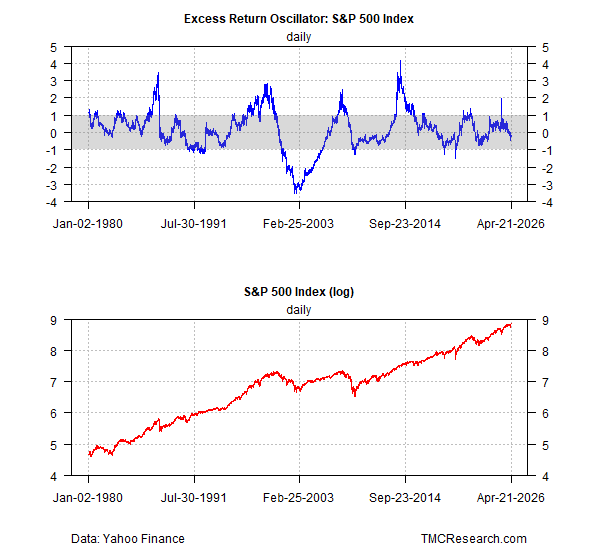
ERO’s current reading reflects market conditions in a “normal” range. That doesn’t mean market risk is nil. Rather, the ERO profile suggests that downside risk appears more likely to come from other sources than valuation in the current macro climate.
Debate rages, of course, over what defines a reasonable valuation these days. For example, bulls argue that artificial‑intelligence‑driven opportunities have raised the premium investors should be willing to pay for a given level of corporate earnings. ERO is agnostic on this point, but coincidentally the metric seems to favor an AI‑based analysis.
Ultimately, measuring market conditions and how they relate to “fair value” requires looking beyond a handful of indicators. Meanwhile, ERO’s current level suggests that a tactical view of valuation doesn’t look threatening.
Encouraging, perhaps, but with a number of other risks lurking—including elevated geopolitical dangers—ERO should be used as an initial measure of market risk rather than the last word on what factors could weigh on investor sentiment in the near term.
