Stocks Grind Higher, But Early Signs of a Defensive Shift Emerging

By James Picerno | The Milwaukee Company
Overall market momentum still positive as S&P 500 extends its uptrend, but…
Defensive signals are emerging: value stocks and consumer staples showing relative strength
Commodities have been recovering lost ground vs. equities lately
TMC Research reviewed several trend metrics for the US stock three months ago and found that while valuation concerns continued, there was “no decisive shift in market’s upward momentum.” Since then, equities are up roughly 5%, based on the S&P 500 Index. Let’s update the analytics to see what’s changed, based on a set of ETFs.
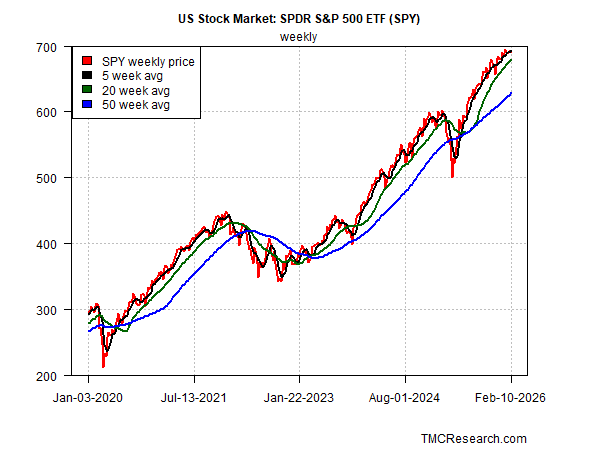
S&P 500 Index Weekly Trend
Looking at the broad trend for the S&P 500 (SPY) via weekly prices highlights an extension of the bull run that was unfolding in our previous update in November. The current profile offers no assurance of higher prices, but it does indicate that the upside bias that was intact in our last update remains intact today.
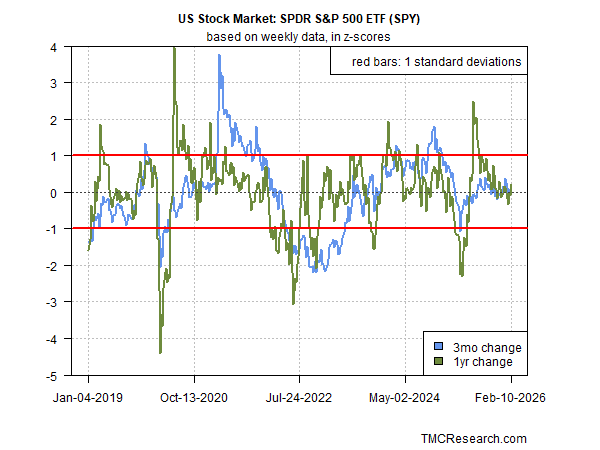
S&P 500 Index 3-Month vs. 1-year Changes
For another perspective, it’s useful to view the stock market through different lenses to corroborate or reject signals from other techniques. In the next chart below, the analysis uses another set of filters and finds that equity returns continue to vary within a “normal” range, which matches the profile in our November review.
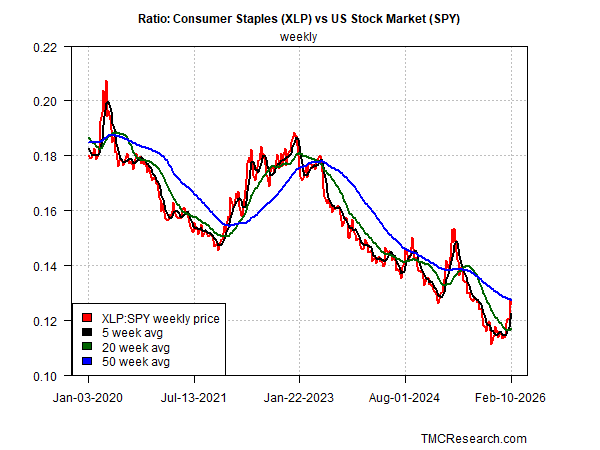
Consumer Staples Stocks vs The Broad Market
One trend that has changed is that of consumer staples stocks (XLP) relative to the broad market (SPY). This ratio is useful to monitor because a shift here can signal periods of elevated market stress, which sometimes favors shares of consumer staples as relative safe havens compared with stocks overall. Note the sharp upturn in the ratio in the chart below, which may be an early indication that the risk appetite for the market is starting to turn defensive. Although the change to date has yet to signal a clear shift, this ratio deserves close attention in the weeks ahead.
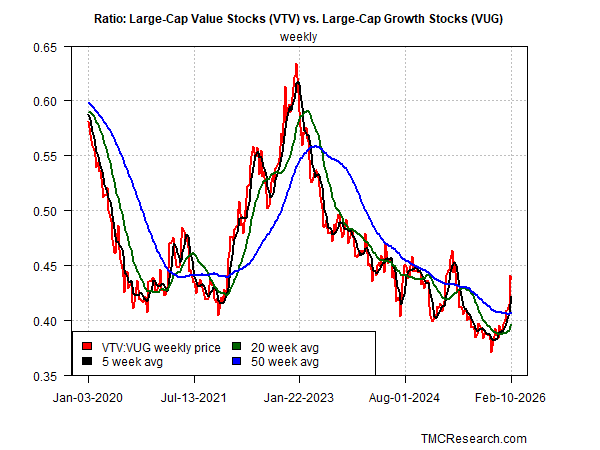
Value vs Growth Stocks
A similar reversal has unfolded recently for value (VTV) over growth stocks (VUG) in the large-cap space. If the rebound in this ratio persists, it may signal an extended run of outperformance for value stocks. A key metric to watch that would strengthen that transition: a rise in the 20-week average above the 50-week average. Although that change doesn’t look imminent, the rise in the shorter-term averages suggests that the odds are looking more favorable for that transition in the near term.
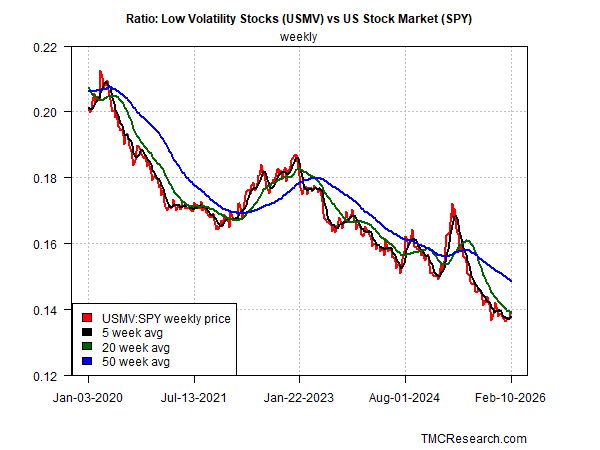
Low-Volatility Stocks vs the S&P 500
Another approach for tracking risk sentiment is watching the relative performance of low-volatility stocks (USMV) vs. the broad market (SPY). Low-vol shares are considered relatively defensive vs. equities in general, but by this measure the trend suggests that the risk-on signaling of recent history rolls on. As such, the USMV-SPY ratio introduces a degree of doubt about the shift toward defensive stocks as discussed above.
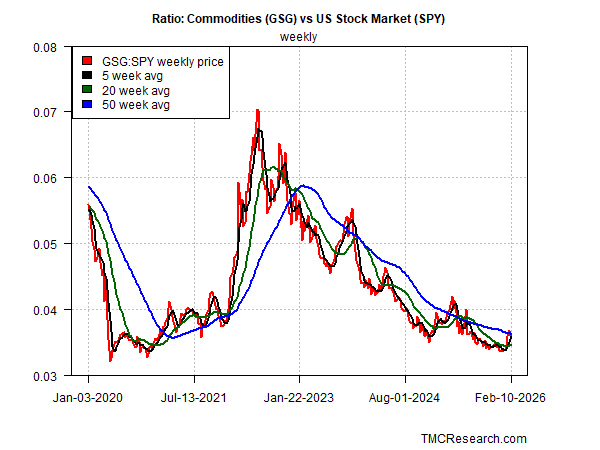
Commodities (GSG) vs. the S&P 500 (SPY)
The final chart compares a basket of commodities (GSG) against the stock market (SPY), which is a proxy for measuring market sentiment in terms of inflation expectations. In contrast to the rise in this ratio when inflation spiked in 2022, the current trend still looks relatively calm. But note that latest upturn, which remains modest so far. If this ratio continues to increase, that could be an early warning that market sentiment is becoming concerned with inflation risk.