Stock Market Trend Signals Remain Constructive Despite Elevated Valuations

By James Picerno | The Milwaukee Company
Valuation concerns persist, but trend metrics show no decisive shift in market momentum
Risk appetite still appears firm, with defensive sectors underperforming broad equities
Technical indicators suggest stability, reinforcing a neutral-to-bullish bias for now
The US stock market continues to climb a wall of worry, raising fears that equities have risen too far, too fast. From a valuation perspective, that’s a valid concern – several metrics indicate that stocks are highly valued, which points to lower returns in the long run. But a review of trend metrics for gauging current market conditions suggest that it’s still premature to argue that sentiment is deteriorating.
In our previous update of the S&P 500 Index’s trend profile in mid-October, we reported that stocks continued to reflect an upside bias. A month later, the market is roughly 1.5% higher (as of mid-day trading on Nov. 17) and the trend has yet to signal trouble. That’s no guarantee of what the future holds, but it’s a useful first step for assessing how risk conditions are evolving.
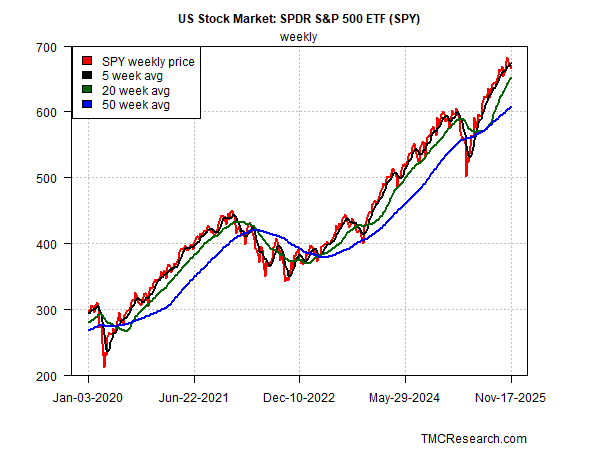
S&P 500 Index Weekly Trend
Let’s start with a look at the S&P 500’s trend via weekly data, based on the SPDR S&P 500 ETF (SPY). Using this perspective as a guide implies that the bull run has yet to show clear signs of breaking down.
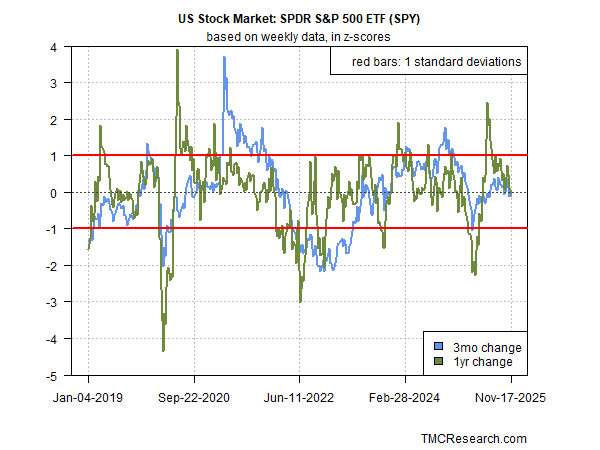
S&P 500 Index 3-Month vs. 1-year Changes
Looking at the market’s technicals from another perspective suggests that that equity returns have been in a “normal” range lately.
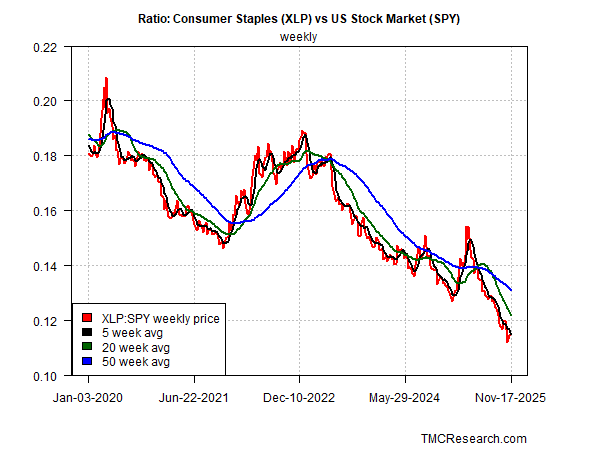
Consumer Staples Stocks vs The Broad Market
An alternative view of market sentiment compares consumer staples stocks (XLP) relative to the broad market (SPY). In times of elevated market stress, staples tend to outperform stocks overall as investors seek relatively safe havens. In those periods that favor lower risk exposure, this ratio (red line in chart below) is rising. But staples continue to underperform the broad market (SPY), which can be viewed as a sign that investors still have a net-positive risk appetite.
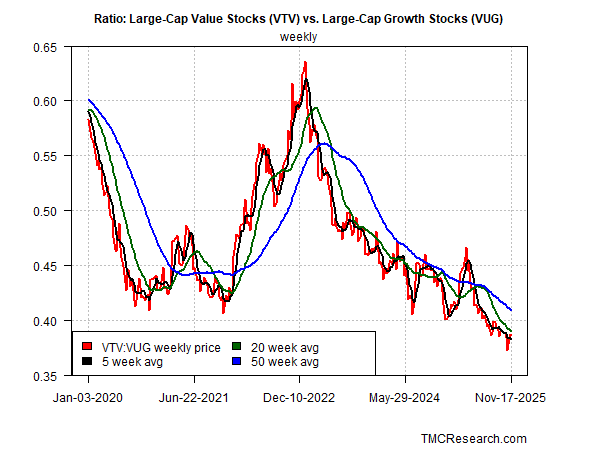
Value vs Growth Stocks
Another market-based estimate of sentiment can be tracked by relative return in value (VTV) vs. growth (VUG) stocks. Value continues to underperform growth, which aligns with the view that the market’s bullish bias persists. As a proxy for identifying a change to a more defensive preference in sentiment, look for the VTV:VUG ratio shown in the chart below to reverse course and start trending higher, which would indicate a stronger demand for relative safe havens.
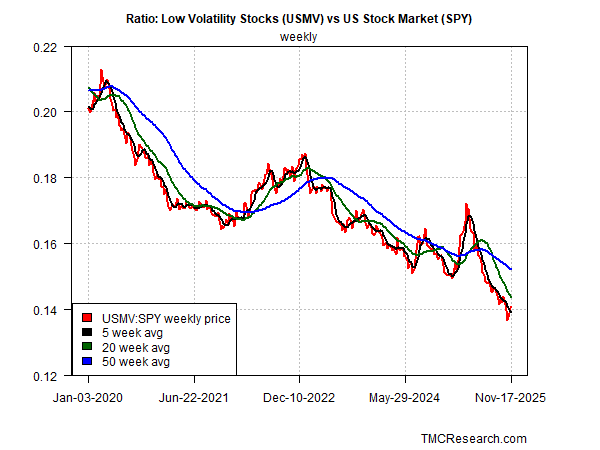
Low-Volatility Stocks vs the S&P 500
Another way to track risk appetite is by tracking the relative performance of low volatility shares (USMV) vs. the S&P (SPY). Low-vol shares are also considered a defensive category of the market, which is why they tend to outperform during periods of rising market stress and investor anxiety. In those periods, the USMV-SPY ratio rises. But the opposite is still unfolding as this ratio trends lower, suggesting this measure of market sentiment has yet to signal a meaningful break in bullish sentiment.
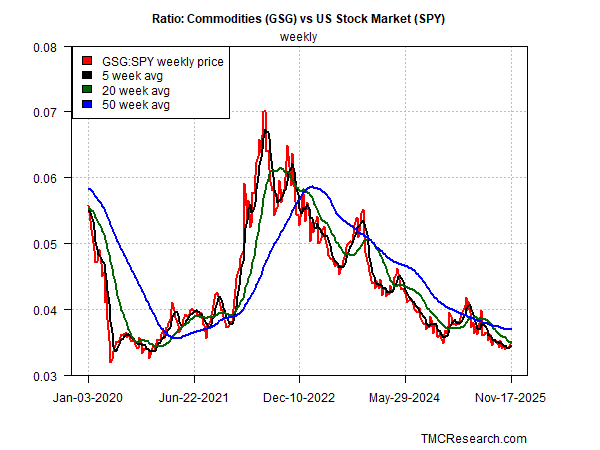
Commodities (GSG) vs. the S&P 500 (SPY)
As a final check on market trend, consider how commodities (GSG) are performing vs. equities (SPY). Given the recent concerns that tariffs may raise inflation, this ratio is useful for assessing market concerns on this front. In 2022, when inflation spiked, commodities (GSG) outperformed stocks (SPY) by a wide margin, per the sharp rise in this ratio in the chart below. The recent trend, however, suggests such a reversal has yet to start.