
Stocks Continue To Defy Gravity Despite Lofty Market Valuation

By James Picerno | The Milwaukee Company
The stock market’s valuation remains elevated, holding near the second-highest level in 150 years, based on the CAPE ratio
AI optimism is fueling the bulls, who argue that productivity gains and a CapEx boom justify the elevated valuation
TMC Research forecasts a substantially softer performance for stocks over the next 10 years
Some analysts call it irrational, others say it’s justified due to artificial intelligence. However you label it, the high valuation of the US stock market has yet to dent investor sentiment.
In June, TMC Research’s 10-year expected return estimate for the S&P 500 Index was an annualized 5.3%, or less than half the pace over the trailing decade at the time. Five months later, the market has continued to climb and so has its valuation. The CAPE Ratio, for instance, has edged up since June and is currently near the second-highest level in 150 years. (CAPE is calculated as the average inflation-adjusted earnings for a rolling 10-year window.)
Our revised estimate of the S&P 500’s return for the next 10 years has ticked up slightly since June, but remains far below the market’s 12.2% realized total return over the trailing decade. By contrast, TMC Research is expecting a substantially softer performance for stocks for the ten years ahead: 5.5% annualized, based on the average estimate for five models (detailed below).
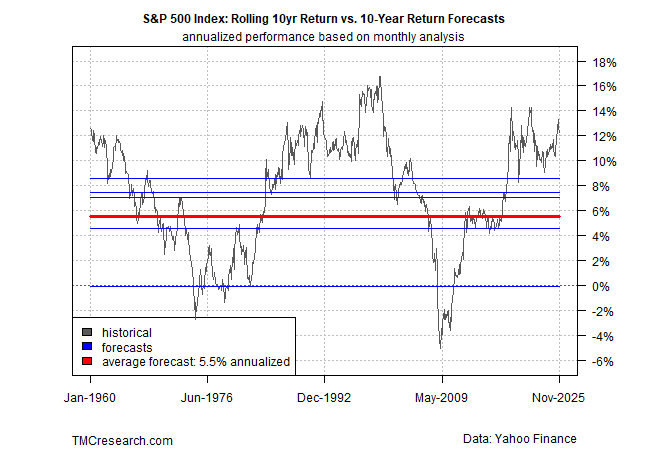
Although all forecasts should be viewed cautiously, it’s striking that all five of the models we use are united in projecting that the S&P 500’s stellar performance history of late will fade for the decade ahead.
Optimists counter that AI is a game changer and so the market’s high valuation is justified. Bullish arguments include expectations for strong real earnings growth (in contrast to the dot-com bubble of 2000) in the years ahead as AI opens up new markets and fuels a productivity revolution. A related boon is the surge in AI-related infrastructure spending, which is fueling a rise in capital expenditures (CapEx) to build data centers, AI chips and cloud infrastructure. This spending has increasingly become the strongest driver and bulwark of an otherwise subdued US economy. Reuters reports that AI-related spending accounted for two-thirds of the annualized GDP growth of 1.6% in the first half of the year.
Even if the bulls are right, it appears that the market has already priced in the best-case scenario. In turn, the market may be vulnerable if the rosy outlook is wide of the mark in some degree. Possible risk factors include excessive AI hype that overstates the business opportunities.
As some critics note, the business models for AI companies and the related eco-system are still evolving and it’s not yet obvious how the long-term prospects will shake out beyond the core beneficiaries to date – i.e., the major tech companies, such as AI-chipmaker Nvidia, Microsoft (strategic partner and investor in OpenAI (developer of ChatGPT)), and Palantir Technologies, a leading data management and analytics firm that builds AI applications for companies.
There are also concerns about the uneven pace of AI adoption across industries, and the productivity boost so far appears to have been modest. A growing concern among investors, which has contributed to the recent pullback, is the heavy use of private credit to finance the AI buildout, along with unconventional circular investment arrangements such as Nvidia’s investment in OpenAI and OpenAI’s commitment to buying Nvidia chips. Similar deals have become increasingly common in the AI eco-system and are raising questions about sustainability and transparency.
Yet taking a cautious view of the stock market’s AI-fueled rally this year, rightly or wrongly, remains a minority view so far. That bias still looks set to run in the short terms, if not longer, as we discussed last week by reviewing trend analytics for the stock market from several perspectives.
The crowd, in other words, is effectively saying that valuations don’t matter – i.e., it’s different this time.
History offers a more cautious, or at least more nuanced, lesson: valuations don’t matter… until they do.
Here’s a quick review of each of the five models used to generate the forecasts above:
CAPE Ratio Model: this stock market valuation indicator, maintained by Professor Robert Shiller, is calculated using real earnings per share for the S&P 500 based on a rolling 10-year window. TMC Research uses the CAPE ratio to generate an implied return for the stock market.
Earnings Yield Model: the stock market’s implied ex ante performance is derived from the S&P 500’s earning yield, defined as the inverse of the price-to-earnings ratio.
ARIMA Model: In contrast with the two models above, which use valuation to infer future return, this estimate uses statistical analysis to generate a forecast. An autoregressive integrated moving average (ARIMA) model is a type of regression analysis that’s run on rolling window of the market’s return history to estimate future results.
Bayesian Model: This statistical model uses lags as a basis for updating so-called “prior beliefs” on a rolling basis to estimate the effects of previous effects on the S&P 500 to forecast return.
Average Historical Return Model: This naïve estimate is a simple average of all the rolling 10-year returns since 1960.
