
Stock Market’s Hot Streak Is Expected to Cool in the Decade Ahead

By James Picerno | The Milwaukee Company
The S&P 500’s trailing 10-year return remains well above the average forecast of our models
Bulls see AI, growth, and Fed cuts keeping the party alive, but valuations suggest the market’s fully priced
The gap hints at mean-reversion risk while optimists counter that a new regime is emerging
The S&P 500 Index’s trailing ten-year return has edged up since our previous performance outlook in November, but today’s revised forecast for the decade ahead is still holding in the mid-5% annualized range.
That’s a modest estimate of future performance relative to the double-digit returns in recent years. The current ten-year gain clocks in at a 13.5% annualized total return, more than a percentage point higher compared to when we ran the numbers in late-November.
Although the market has turned relatively sedate so far in 2026 (the S&P is roughly flat year to date through Feb. 13), the rear-view mirror continues to highlight a roaring bull market. Consider: the trailing 13.5% ten-year gain is nearly double the market’s 7.4% average annualized return since 1960.
Will the market’s turbocharged performance continue? The bulls offer several scenarios for expecting the party to endure, including an AI-fueled rise in corporate profits and productivity, a resilient US economy, and expectations that the Federal Reserve will provide more liquidity support through ongoing rate cuts this year.
The question is whether the market’s fully valued and already pricing in those and other best-case-scenario assumptions? In other words, is this as good as it gets?
The future’s always uncertain, but it’s useful to run the numbers on several models to review changes in expectations vs. how the current outlook compares with history. TMC Research updated the five models that we routinely monitor and the results indicate that the S&P 500’s expected return for the decade ahead still looks relatively modest next to the sizzling run in recent history.
The average performance forecast for the ten years through 2036 is 5.6% annualized. That’s a tick above November’s forecast and (still) far below the market’s 13.5% trailing return over the past decade.
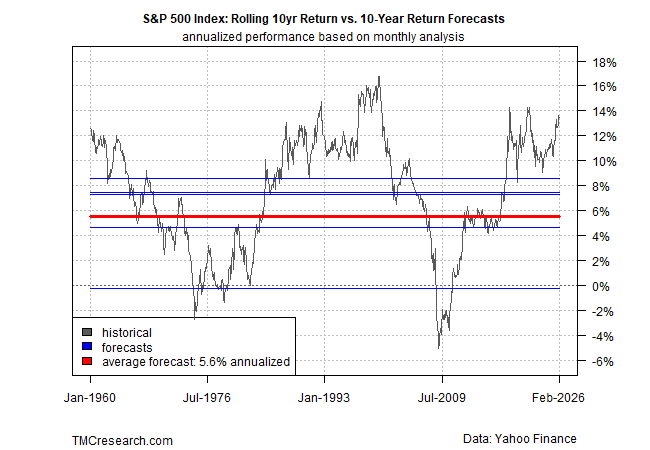
Forecasts should always be viewed cautiously, but the large gap between ex ante and ex post performance suggests some degree of mean reversion may be brewing. All of which boils down to the age-old question: Is it different this time? If so, why?
The future isn’t a slave to the past, but with a market outperforming so dramatically, the burden of proof is increasingly on the bulls to justify why lofty return expectations are still a reasonable forecast.
Here’s a quick review of each of the five models used to generate the forecasts above:
CAPE Ratio Model: this stock market valuation indicator, maintained by Professor Robert Shiller, is calculated using real earnings per share for the S&P 500 based on a rolling 10-year window. TMC Research uses the CAPE ratio to generate an implied return for the stock market.
Earnings Yield Model: the stock market’s implied ex ante performance is derived from the S&P 500’s earning yield, defined as the inverse of the price-to-earnings ratio.
ARIMA Model: In contrast with the two models above, which use valuation to infer future return, this estimate uses statistical analysis to generate a forecast. An autoregressive integrated moving average (ARIMA) model is a type of regression analysis that’s run on rolling window of the market’s return history to estimate future results.
Bayesian Model: This statistical model uses lags as a basis for updating so-called “prior beliefs” on a rolling basis to estimate the effects of previous effects on the S&P 500 to forecast return.
Average Historical Return Model: This naïve estimate is a simple average of all the rolling 10-year returns since 1960.
