
What’s The Stock Market’s Implied Recession Nowcast?

By James Picerno | The Milwaukee Company
The US stock market is close to falling 20% from its previous peak, which is considered the trigger for a bear market. Given the extreme volatility of late, by the time you read this the S&P 500 Index may have already fallen below that line. Does the market’s slide offer any insight into the outlook for US recession risk?
A few weeks ago we reviewed the US stock market’s implied estimate of recession risk and reported that the probability that the economy was contracting was low. In the wake of the recent market turmoil, it’s timely to re-run the numbers.
The quick takeaway: the inferred risk of recession has increased lately, but it’s not yet at a level that suggests a high confidence-estimate that an NBER (National Bureau of Economic Research) defined downturn is fate. That could change in the days and weeks ahead, of course. The market is always reassessing the outlook. Meantime, it’s useful to set up a framework for approximating Mr. Market’s outlook to help cut through the noise that can cloud the real-time view and trying to glean information from the latest headlines.
The obvious caveat: Using equities as a recession indicator should be viewed cautiously. The stock market contains some amount of information about the economic outlook, but separating signal from the noise is difficult. As the economist Paul Samuelson’s famously quipped: “The stock market has predicted nine out of the last five recessions.”
The “wisdom” of the crowd is typically pricing in many things at once, such as earnings prospects, geopolitical risk, expectations for Fed policy, and many other items on the horizon. And it’s fair to say that the market is hardly an infallible indicator for pricing in what lies ahead. The future, after all, is forever uncertain.
It’s also true that the US stock market is a huge sentiment machine that processes a massive amount of forecasts, assumptions and guesswork and consolidates it all into one continually updated data point (such as the S&P 500). Equities may be too volatile in the short term to rely on as a stand-alone indicator, but they’re also too important to ignore.
Accordingly, the stock market is a useful addition to the macro toolbox for monitoring the economic outlook. A reasonable first approximation is extracting the market’s implied probability for recession risk from drawdown. The logic: When the market falls, it could be a sign that investors are becoming worried that the economy is weakening.
The question is how to define a market decline that’s relevant as a forward-looking indicator while, at the same time, minimizing short-term noise? To limit guesswork that may be vulnerable to behavioral bias, the analysis should rely on quantitative modeling in some degree.
As a first step, we can use the S&P 500 Index’s drawdown as a rough approximation of the market’s “thinking” for economic expectations. The further the market falls from the previous peak, the higher the implied odds that the crowd’s worried about the growth prospects.
On that basis, the first chart inverts and rescales S&P 500 drawdowns as a crude approximation of recession risk since 1968. The vertical gray bars indicate the historical recessions, per NBER.org. Unsurprisingly, the track record is mixed. The market offered a timely indicator of several past recessions, but it also missed a few and sometimes priced in trouble that turned out to be a false alarm.
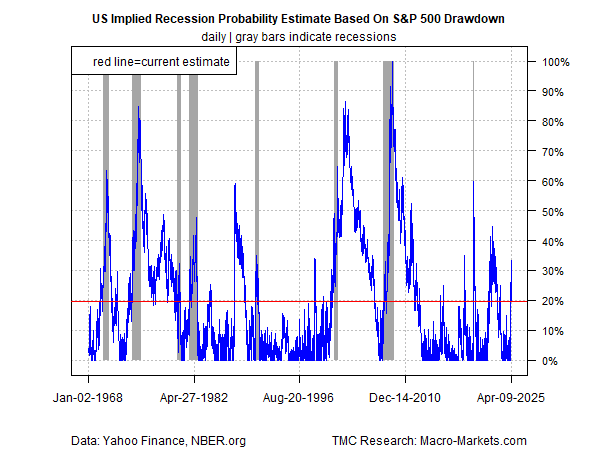
The current estimate (as of Apr. 9): a roughly 20% probability that a recession has started or is near, is down from near-30% a few days earlier, before Wednesday’s dramatic market recovery. Only time will tell if the estimate is accurate, but it’s fair to say that the market is pricing in higher odds for headwinds lately, but has yet to go all-in on assuming the worst.
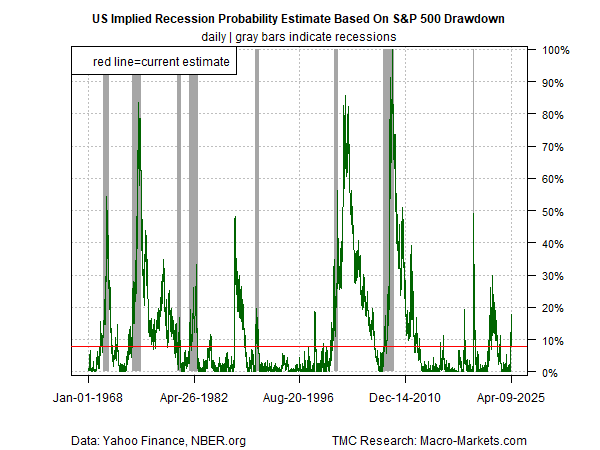
Running the raw drawdown data through a probit model shows similar results. Note, however, that the current nowcast of recession probability is substantially lower at 8%. Here, too, the estimate fell, from nearly 18% following the sharp recovery in stocks on Wednesday.
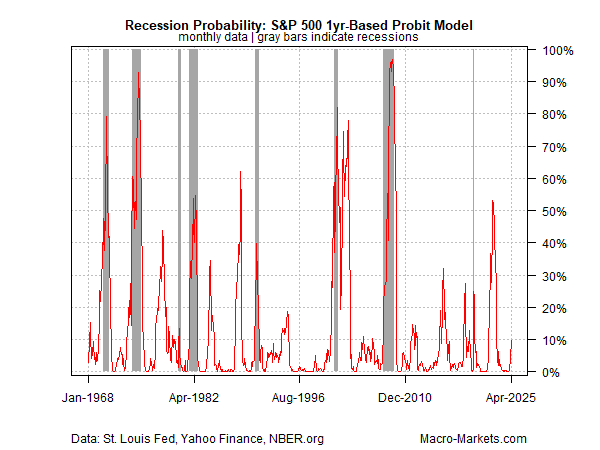
A third model estimates recession risk via the rolling 1-year return on the S&P 500 and then runs the results through a probit model. To filter out some of the noise that affects the daily frequency in the analysis above, the model shown below uses the monthly average of daily data. The results are arguably more reliable, or at least less noisy. The current recession probability nowcast via the monthly analysis shown below is nearly 10% for the April estimate, based on this month’s average for S&P 500 data through yesterday’s close (Apr. 9).
Current economic and financial conditions are highly fluid at the moment and so the analysis above could change quickly. Exactly how and when the market’s implied forecast will adjust is unknown, but if we see clearer signaling, one way or the other, the shift will reflect important information about how investors overall are estimating macro risk.