
What Should You Expect During A Bull Market For Stocks?

By James Picerno | The Milwaukee Company
By one measure, the current bull run is approaching its third anniversary
The stock market is up roughly 80% since the current bull run started
Every bull market is unique, and results vary dramatically in terms of risk and reward
As bull markets go, the current run higher is close to the weakest over the past seven decades. But the current rally is also one of the shortest on record to date, and so it’s premature to make assumptions about where this rally is headed.
There are varying definitions of a bull market, and so you can torture the numbers to say a lot of things. In this review we’re using a relatively common, although contested measure: A rally off the previous bear market bottom. As long as the rebound avoids a 20% from the previous peak, which applies so far, the bulls continue to run, according to this standard. The current cycle started in mid-October 2022, when the bear market ended. (See our profile of bear markets here.)
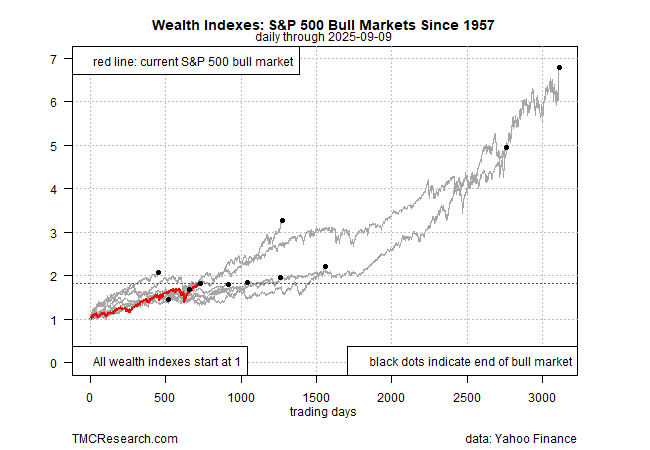
One way to read the ongoing rise in stocks vis-à-vis history is to recognize that most bull markets last substantially longer than the current 23-month affair. On that basis, one is tempted to reason that the full scope of the current cycle still lies ahead.
A key source for market optimism comes from the earnings profile, which continue to skew positive. The research firm FactSet estimates that earnings growth for the S&P 500 Index for the third quarter is 7.5%. If correct, the increase will mark the ninth consecutive quarter of earnings growth for the S&P. The data firm also notes that the number and percentage of S&P 500 firms issuing positive earning guidance for Q3 is well above the five-year average.
One caveat is that communication services and information technology are driving the lion’s share of earnings growth lately – a trend that gives some observers pause because it suggests that the market rally is overly dependent on a handful of tech darlings. But if artificial intelligence (AI) fuels a new era of growth, as some analysts predict, one could argue that the bull market is still in its early innings. On that front, the optimists point out that AI-driven capital expenditures continue to increase, which arguably lays the foundation for keeping the bulls humming.
Another wall of worry for the market to climb is deciding if expectations that the Federal Reserve will cut interest rates next week is a warning sign for the business cycle. History shows that the central bank tends to ease policy ahead of recessions. Although the economy is still expanding, providing crucial support for stocks, the downshift in hiring in recent months could be a sign that growth overall is cooling.
History Doesn’t Repeat, But Sometimes It Rhymes
If the bull market rolls on, it’s useful to keep in mind that volatility could (and probably will) emerge at times. A full bull cycle lifts equities substantially, but rough patches should be expected in the interim.
In the previous ten bull markets, the maximum drawdown in each ranged from about -10% to just short of a hefty 20% peak-to-trough decline. The history begs the question: Is it still a bull market if the market has fallen 19.9% from the previous peak?
It’s a fair question, albeit one without an answer that will satisfy every investor. The larger point is that the market tends to run through long-running periods of hot and cold cycles, and at the moment the cycle is clearly in a bull phase.
Predicting when the upswing ends is impossible, but there will likely be warnings. Short of sudden and expected shock, most bull markets end over some period of time rather than die suddenly.
For example, the short bear market in 2022 (based on a 25% drawdown that year) started in January. That’s obvious with the benefit of hindsight, but in real time all the usual challenges kept investors guessing. As the weeks unfolded, a growing list of warning signs emerged. For example, the trend profile for the S&P 500 turned negative in mid-March that year, based on the slide in the index’s 50-day average below its 200-day average.
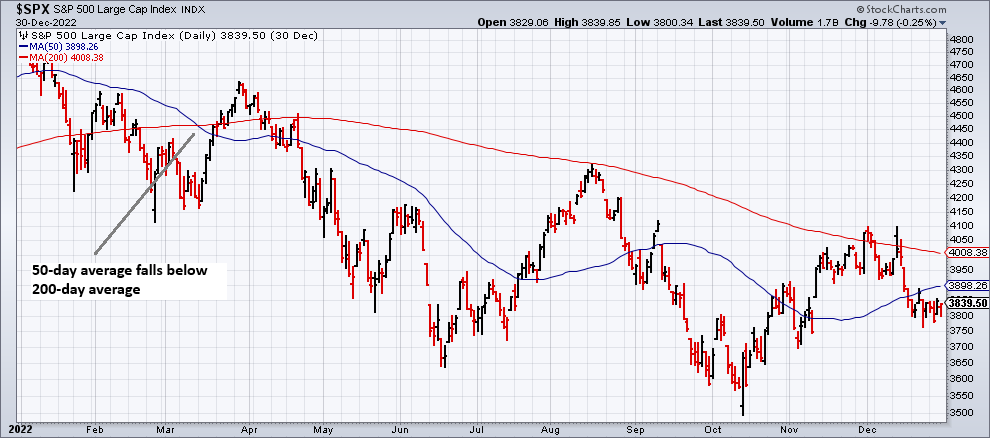
Using a single pair of moving averages to date the start of a bear market oversimplifies the necessary analytics for robustly evaluating the market’s trend bias in real time. Yet this example is a useful first approximation for assessing the trend today vs. 2022. For comparison, here’s how the S&P 500 currently stacks up:
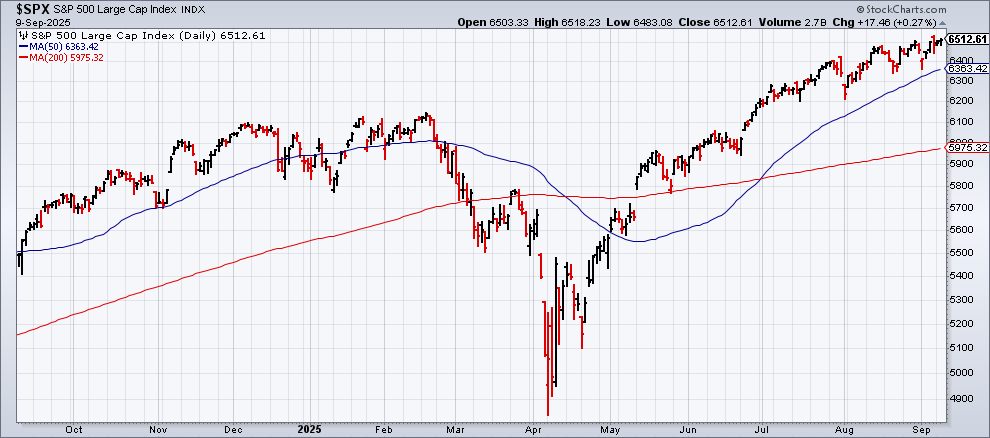
Clearly, the trend remains bullish, at least by the standards of 50/200-day averages. It’s also clear that those trailing windows in isolation are far from perfect for real-time dating of bear markets. This year’s spring correction is a case in point: The decline was sharp and swift, cutting the S&P by nearly 19% -- just short of a 20% bear-market trigger.
The ensuing recovery was also speedy, and for now the market’s recovery endures. When will it end? No one knows, but this much is clear: The current upside bias tells us that the bull market is still running.
