
What Do Bond Market Drawdowns Tell Us About Diversification?

By James Picerno | The Milwaukee Company
Bonds are a key component for a robust asset allocation strategy, but the asset class isn’t immune to sharp drawdowns
In the worst-case scenario, bonds and stocks suffer sharp and simultaneous corrections
One implication: Asset allocation should emphasize alternative asset classes beyond the traditional stock-and-bond portfolio and, increasingly, that appears to be the mainstream view
The bond market is often the first choice for diversifying a portfolio of stocks, but fixed-income securities aren’t a free lunch.
Yes, the risk that accompanies bonds is usually lower, and returns tend to offer relatively low correlation vs. stocks. So far, so good. But bonds can be volatile too, and so it’s worthwhile to review the asset class’s history for managing expectations and thinking about why it’s crucial to look beyond fixed income for designing a robust asset allocation plan.
History lessons
A useful first step: studying drawdown history. The peak-to-trough declines for fixed-income securities are generally milder compared with the stock market, but bonds sometimes take a beating. Even worse, it’s not unprecedented for fixed income to suffer when stocks are sliding.
For perspective, let’s dig into the history of the Vanguard Total Bond Market Index Fund (VBMFX), which tracks the Bloomberg US Aggregate Float Adjusted Index. The mutual fund is an investable proxy for the investment-grade bond market. Most of the portfolio is held in US Treasuries (52%), with investment-grade corporate in second place (25%), according to Morningstar.com. The fund’s effective maturity is roughly 8 years. The 1986 launch date provides a multi-decade track record for assessing how the “bond market” fared over multiple business cycles and across various macro and financial-market shocks.
Mild drawdowns… most of the time
The majority of VBMFX’s drawdowns are softer than -5%. But as the chart below shows, the fund has suffered sharply steeper losses at times. The deepest since its 1986 launch: the 19.1% drawdown that started in 2020, from which the fund has yet to fully recover, leaving the mutual fund 6.1% below its previous peak.
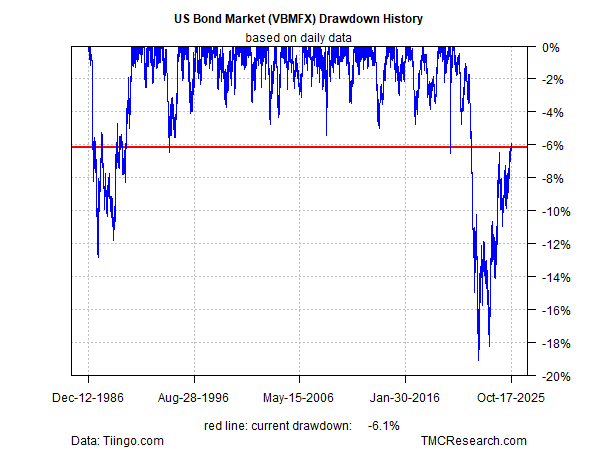
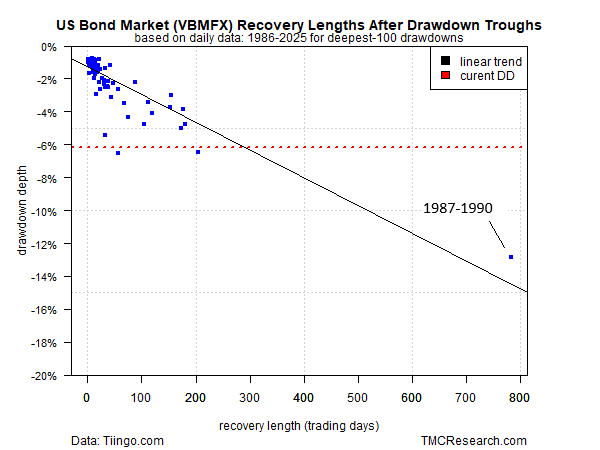
The good news: bonds typically recover quickly from drawdowns. The average rebound to the previous high is 37 trading days for VBMFX. Encouraging, except that the outliers for recovery are far longer, as recent history reminds. Indeed, the current recovery from the trough is ongoing and at the moment is clocking in at hefty 749 trading days, second only to the 1987-1990 recovery, which took 782 days.
Although bond market corrections can be painful, the next chart below reminds why fixed income is often the go-to diversification asset relative to stocks. For direct comparison, the VBMFX drawdowns are set to the same scale as the stock market’s (S&P 500). The key takeaway: each asset’s drawdown follows a distinct path, and bonds have fared much better than stocks for minimizing peak-to-trough declines, or so history advises.
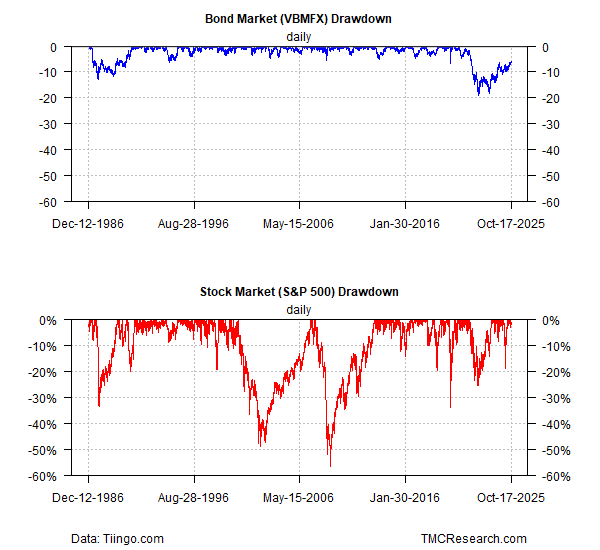
Not only are the bond market’s drawdowns milder in most cases, they’re usually milder when the stock market corrections are the deepest. Not surprisingly, the correlation between the two sets of drawdowns since 1986 is a mildly negative -0.03, which is close enough to zero to conclude that there’s no relationship between the two as a general principle.
Outlier risk
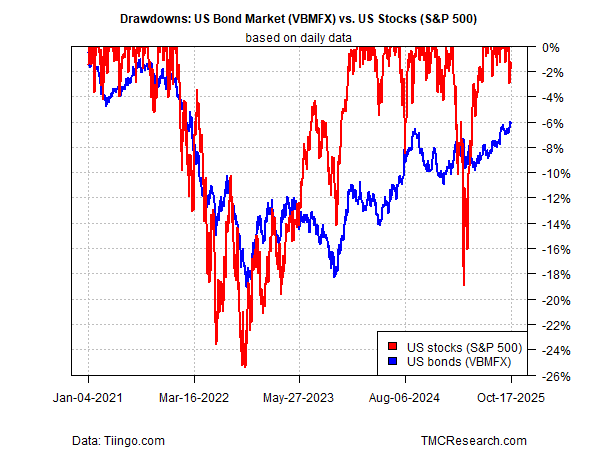
There are exceptions, which is to say that there are times when the bond and stock markets suffer steep, contemporaneous drawdowns. The two main examples since VBMFX’s launch: 1987 and 2022. For instance, the next chart zooms in on the latest set of deep, simultaneous drawdown episodes for stocks and bonds. The decision by the Federal Reserve to start hiking interest rates in 2022 was part of the mix that took a hefty bite out of equities and fixed income that year.
Managing expectations and expanding the opportunity set
Bonds, in other words, don’t always provide the expected diversification for hedging stock-market risk. Although that scenario is the exception to the rule, it does happen and presumably it will again.
Despite the potential for tail risk, bonds still deserve a core role in most asset allocation strategies. But history also suggests that US fixed-income securities may not provide the anticipated ballast for every significant stock market correction over a business cycle or two.
Thinking beyond the standard portfolio strategy has become increasingly important as financial markets exhibit signs of a structural shift. Examples include: a relatively prolonged drawdown-recovery phase for the aggregate bond market compared with the relatively swift drawdown-and-recovery cycles seen in US large-cap equities. This emerging pattern appears to reflect the evolving macroeconomic landscape, transitioning from an extended period of quantitative easing to a consistently moderate inflationary regime characterized by generally elevated borrowing costs.
The implication: asset allocation strategies should focus on alternative asset classes beyond US stocks and bonds. Fortunately, there are a number of possible solutions for strengthening a portfolio’s defensive guardrails, as we discussed recently.
Consider, for instance, that in late-October 2022, at the point of maximum drawdown for VBMFX, several markets were posting year-to-date gains and outperforming the fund, based on a set of ETFs: commodities (DBC), cash (SHV) and gold (GLD). Note, too, that large-cap stocks (IVE) and short-maturity Treasuries (SHY), although nursing losses for the year at that point, were suffering less.
