
US Stocks Fall The Most Since The S&P 500 Index’s 2022 Correction

By James Picerno | The Milwaukee Company
The latest market decline marks a 17% drawdown from the previous peak, the deepest since the 2022 drawdown.
History suggests the market could potentially return to its previous high in a bit more than a year.
A crucial factor for the market’s path ahead is how tariff policies play out – in the US and abroad.
The current sell-off in the US stock market is now the 15th steepest decline from the previous peak, based on the S&P 500 Index’s drawdown history since 1950.
No one knows how deep the correction will go, or how long it will last, but reviewing the historical record for drawdowns provides some context for managing expectations.
As the first chart reminds, the current peak-to-trough slide is still within a typical range, based on drawdowns over the past 75 years. The median slide for the deepest 30 selloffs is -16.1%, or slightly less steep than the current -17.3% drawdown (based on Apr. 4 trading as of 2:45 pm eastern).

The second chart offers additional context by showing how the current decline (red line) compares with the 30 deepest drawdowns since 1950. One of the current drawdown’s distinguishing characteristics is the relatively rapid speed of the downturn.

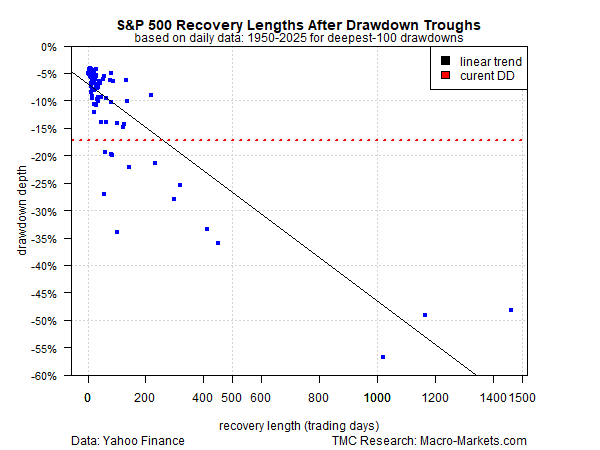
For another perspective, the third chart compares the depth of drawdowns vs. the subsequent recoveries in terms of trading days. The historical relationship suggests that the current drawdown will take a bit more than a year for the market to fully recover its previous high, based on the best fit via a linear regression model and the current decline (if it marks the trough). That’s neither quick nor extreme but well within the realm of recoverability for long-term investors.
A crucial factor that will likely play a role, perhaps the dominant role, for the market’s path ahead is how tariff policies play out – in the US and abroad. It’s fair to say that uncertainty is high as investors struggle to second-guess how (or if) policies will evolve.
What is clear is that the S&P 500 drawdown history suggests the current decline, in theory, has plenty of room to deteriorate further in terms of depth and duration. Whether that proves to be a reasonable guesstimate, or not, probably depends on how the trade situation unfolds.