
Updated CBO Outlook Still Flags Deepening Deficits and Rising Fiscal Strain

By James Picerno | The Milwaukee Company
CBO sees the federal budget deficit widening in 2026 and beyond
Deficit-to-GDP ratio is projected to climb from 5.7% today to 6.7% by 2036
Markets aren’t stressing yet, but fiscal pressures could lift market risks in the years ahead if the deficit continues to rise
The Congressional Budget Office (CBO) this week revised its budget outlook for the federal government and the results (still) look worrisome. In line with recent updates, the US deficit remains on track to deteriorate further. The forecast may not be surprising in the red-ink-drenched post-pandemic period, but the new estimates remain concerning by highlighting the government’s deteriorating fiscal profile.
CBO projects that the shortfall will deepen in 2026 to $1.853 trillion, slightly more than 2025’s $1.775 trillion deficit. Looking further down the road offers a similarly concerning trajectory. Over the coming decade, the non-partisan budget office predicts that the US deficit-to-GDP ratio will steepen to 6.7% in 2036 from the current 5.7%.
Policy analysts warn that the size of the deficit is especially troubling because the current level of red ink is unusual for a peacetime economy that’s growing. Presumably during the next recession, if history’s a guide, the fiscal hole will deepen as tax revenue retreats and demand for government spending rises, which is typical for periods when the economy contracts.
The projection for “sustained large deficits are historically unusual, given that the unemployment rate is projected to remain below 5%,” CBO Director Phillip Swagel said in a statement.
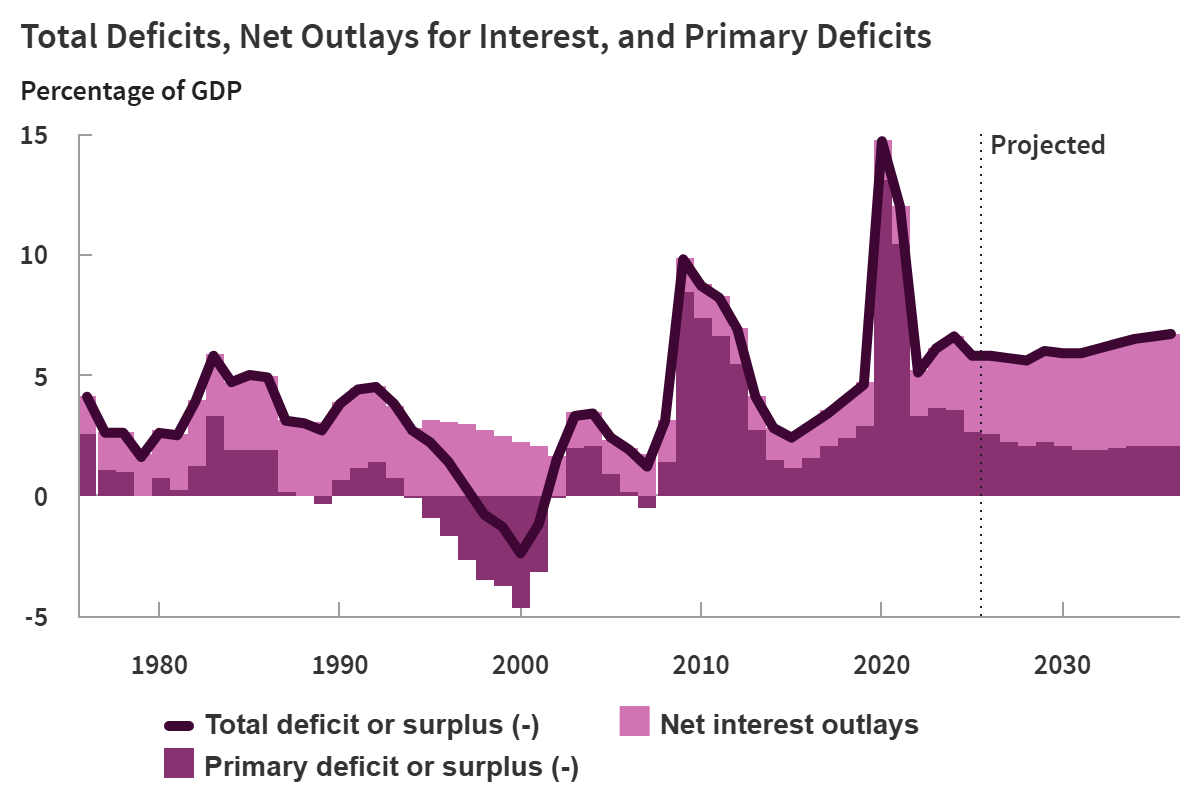
A key impact of the growing debt will be reflected in projections for rising interest costs. “Net outlays for interest go from $1.0 trillion in 2026 to $2.1 trillion in 2036, rising from 3.3% of GDP to 4.6%,” Swagel added.
Baseline assumptions
Forecasts are subjective, of course, and so reasonable minds can debate how the future will unfold. CBO’s modeling includes the projection that economic growth will pick up in 2026 (real GDP is expected to rise 2.2% this year, up from 1.9% in 2025), and then downshift to 1.8% for 2027 through 2036. Change the prediction for economic growth and the budget forecast will change, for good or ill, depending.
The White House paints a brighter outlook, claiming that CBO tends to lowball economic growth. “Smaller deficits and higher growth thanks to President Trump’s economic policies are going to slash, not grow, America’s deficit-to-GDP rate,” said White House spokesman Kush Desai.
No matter who’s making the forecast, one constant remains: the future is uncertain. That’s a reminder that the CBO’s forecast can, and probably will, vary from reality, depending on many factors.
What is clear is that the government is running an unusually hefty budget deficit and it’s not obvious that Washington is set to muster the political to meaningfully trim the red ink. Left unchecked, the deepening shade of red carries non-trivial implications for the years ahead on several fronts, including economic growth, interest rates and inflation.
The Fiscal Risk Index
A crucial task is trying to figure when (if?) the red ink crosses a red line for financial markets. That’s challenging due to the multiple factors that go into the analytics. Behavioral economics is part of the mix: At what point do investors cry “uncle” and demand higher risk premiums?
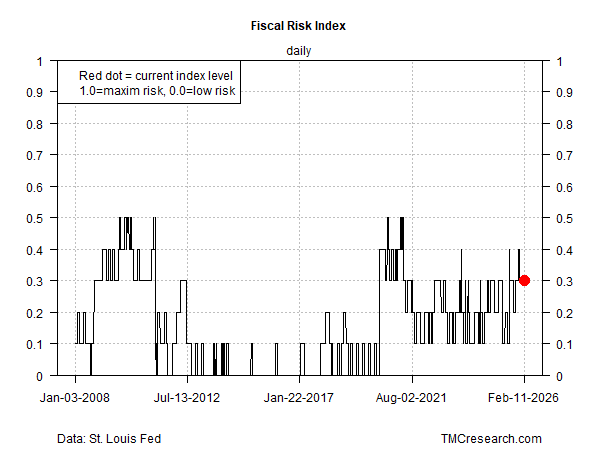
For some initial perspective on how a short list of relevant factors stack up, TMC Research monitors the ebb and flow via our Fiscal Risk Index (FRI). The current reading is 0.3 (per the chart below). That’s up from recent history, but still below the previous peak set during the pandemic-related surge of government spending and far below the 1.0 mark, which indicates extreme risk.
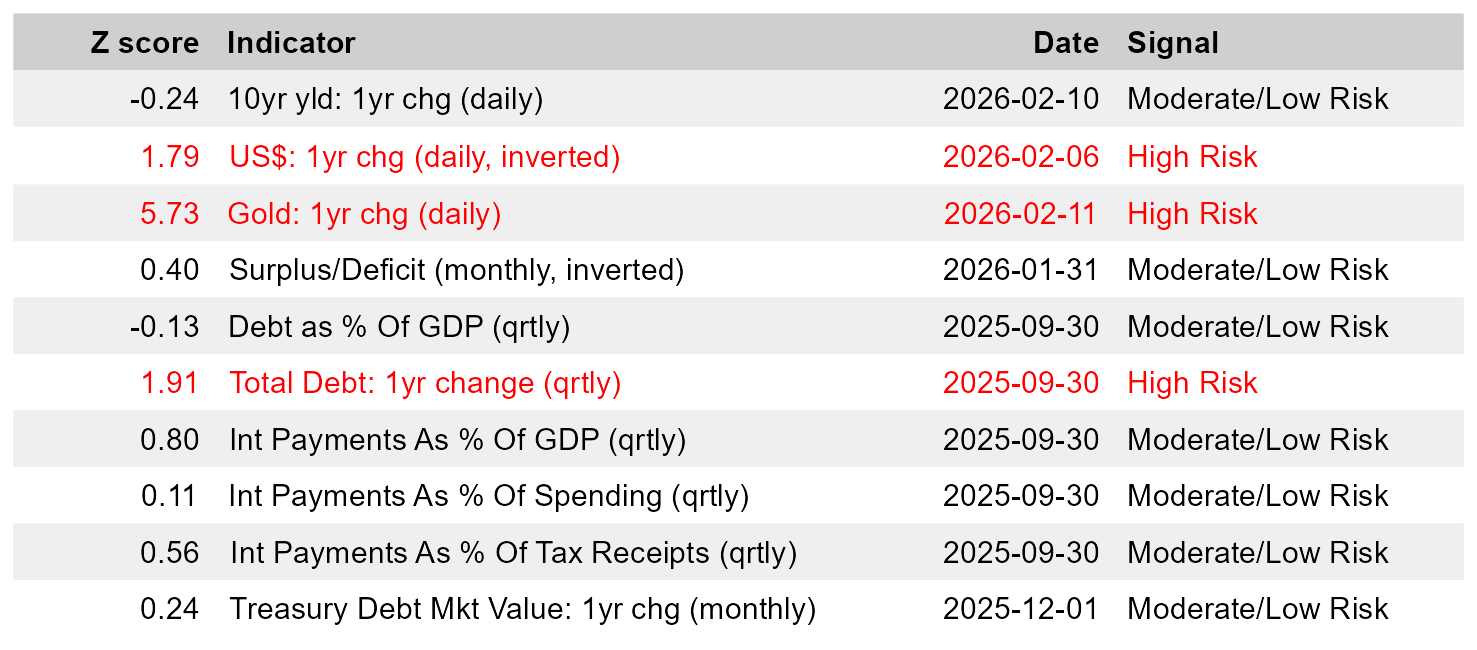
Among FRI’s ten inputs (see table below), three are flashing warning signs, relatively speaking, based on our assumptions for modeling the data: dollar weakness, surging gold prices, and a hefty increase in total government debt over the past year.
To be fair, this is one approach to modeling fiscal risk, and it comes with several caveats. First, there are additional inputs that may be relevant to compliment the ten used in FRI.
Perhaps more importantly, for any mix of variables and a set of parameters, no one knows where a critical threshold lies that, if crossed, financial markets become dramatically less tolerant of government profligacy.
The main value of FRI is comparing how fiscal risk evolves for a given, if imperfect, measure of fiscal risk vs. history. On that basis, the FRI chart above is useful for comparing how a set of indicators and parameter assumptions have changed and tracking how those conditions shift, or not, in the months and years ahead.
FRI isn’t flashing a crisis today, at least by its own standards, but that could change for the worse, assuming the CBO’s forecast is correct.
