

By James Picerno | The Milwaukee Company
Five of six trend indicators continue to support a bullish outlook for U.S. stocks
Technology shares remain a key source of market strength and leadership
One caution flag is growing investor preference for value stocks, which may signal a more defensive tone
History suggests that lofty valuations should weigh on future returns, yet that warning has persisted in recent years while the bull market has continued to push higher. That doesn’t mean market cycles have been repealed, only that predicting when they will peak remains as difficult as ever. Given the inherent uncertainty of the future, a more practical approach is to track market behavior in real time and watch for early signs that leadership or risk appetite is weakening.
Rather than relying on forecasts, we can evaluate the bull market through several lenses to gauge whether the underlying trend is showing signs of deterioration. Because no single indicator tells the whole story, the following charts examine a range of trend measures that collectively provide context for judging the market’s underlying health.
Based on the trend measures reviewed below, the bull market appears to remain on solid footing. That is no guarantee of future performance, but the balance of the evidence for now still suggests that upward momentum continues to dominate. One of the six indicators is beginning to flash a cautionary signal that could prove significant, but for now it remains an outlier within an otherwise constructive set of market trends.
The charts below use ETFs to evaluate market conditions, focusing on a set of ratios that profile investor sentiment. In all cases, rising values suggest a bullish bias, and vice versa.
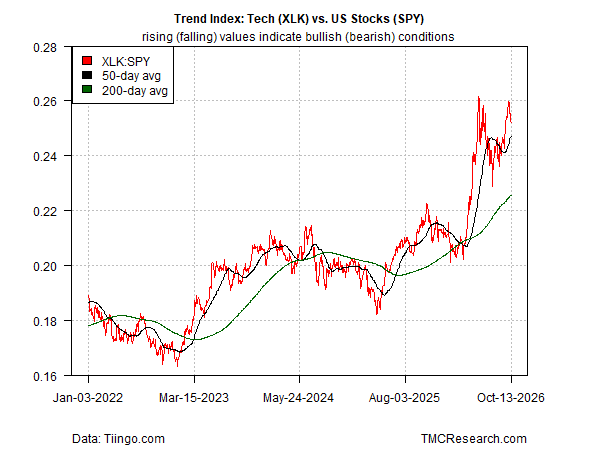
Let’s start with the elephant on Wall Street: technology stocks. A crucial driver of the market’s gains in recent years has been the enthusiasm surrounding artificial intelligence (AI), which has lit a fire under technology shares (XLK). As a result, the sector has significantly outperformed the broader market benchmark (SPY). Conventional wisdom holds that as long as tech momentum remains positive, it may continue to provide a tailwind for the market overall. By that measure, the upside bias for tech still appears quite strong.
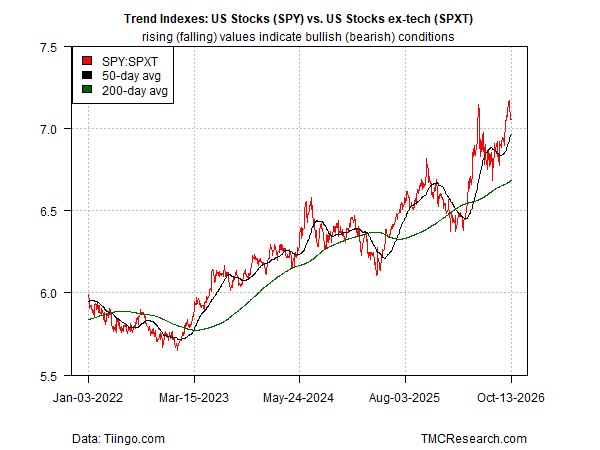
Another way to analyze the influence of technology, whether positive or negative, is to compare the market benchmark (SPY), which is market-cap weighted and heavily influenced by large-cap tech shares, with the same benchmark excluding technology stocks (SPXT). As the next chart shows, this ratio continues to reflect a strong upside bias, offering further evidence that the bullish influence of tech remains intact, at least for now.
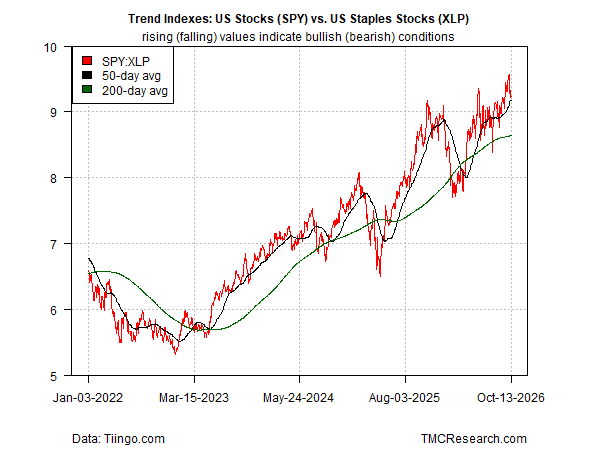
Looking for signs of distress through the lens of consumer staples stocks (XLP) also fails to uncover meaningful warning signs. The market benchmark (SPY) continues to outperform this defensive bucket, suggesting investors remain comfortable favoring economically sensitive sectors over more traditionally defensive corners of the market. When this ratio starts to trend lower on a persistent basis, that would signal a shift in sentiment.
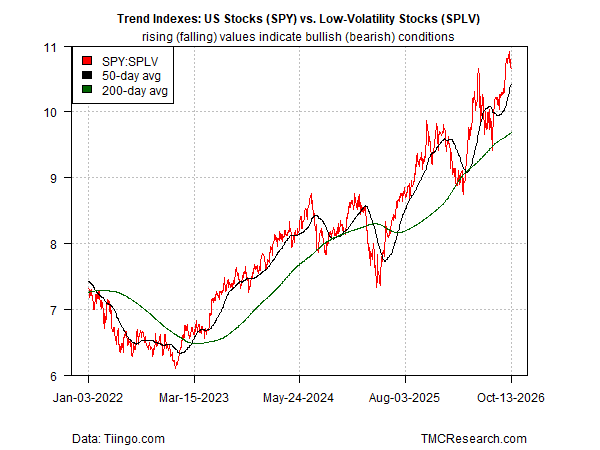
A similarly upbeat trend appears when comparing U.S. stocks (SPY) with a portfolio of low-volatility shares (SPLV), another traditionally defensive segment of the equity market.
One potential warning sign: the recent weakness in growth stocks (VUG) relative to value shares (VTV). The downturn in the trend shown in the chart below suggests that demand for value stocks, often viewed as a lower-risk equity refuge, is increasing, as reflected by the decline in the VUG:VTV ratio. If this downside trend continues to strengthen, it may indicate that investors are becoming more cautious about the market outlook, which could start to weigh on the ratios listed above.
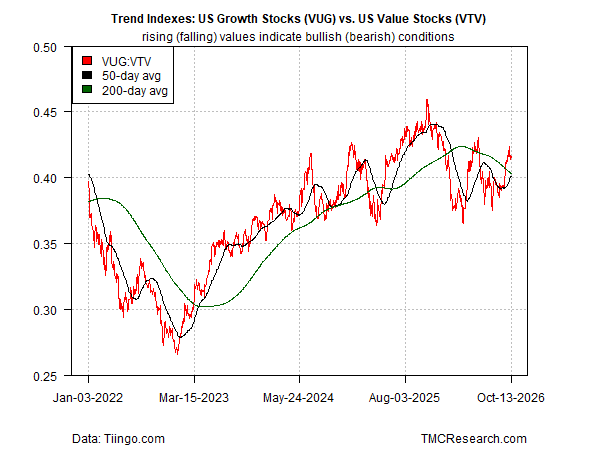
Despite the relative strength of value stocks, bullish sentiment still appears to have the upper hand. How long that lasts is anyone’s guess. Forecasting the next turning point is difficult, if not impossible. A reasonable alternative is to monitor the market’s trend profile from multiple perspectives and let the weight of the evidence guide expectations. For now, that evidence continues to favor the bulls, although the shift toward value stocks is a reminder that investors should remain alert for signs that the market’s leadership and risk appetite may be starting to change.
