Monitoring Factor Risk Cycles Is A Valuable Tool For Portfolio Design And Analysis
By James Picerno | The Milwaukee Company
Relative performance for risk factors can provide potential insights for portfolio tilting decisions
Monitoring factor trends in relative terms can also help explain why a portfolio is leading or lagging
Analyzing these relationships may not be widely followed, at least for some factors, but they offer a possible opportunity for boosting alpha-related portfolio decisions.
Every investment portfolio is a bundle of risk factors — value and growth stocks, small-cap vs. large cap stocks, and so on. Regardless of whether you target specific factors or ignore them, these building blocks of markets are driving return and risk. The only question: Are you monitoring and evaluating factor trends?
The answer should be “yes” because risk factors go through cycles, and so there are times for tilting in favor of one vs. another. Even if you prefer to forgo active factor tilts, keeping an eye on trends in this corner of risk analysis is useful for managing expectations and understanding why a portfolio may be leading or lagging. Factors are usually a key part of the answer.
ETFs have democratized factor investing and so a lot of the mystery has been revealed over the years in terms of publicly available information. But a closer look at relative trend cycles can still be useful – the relative performance difference between, say, large-cap and small-cap stocks. This data isn’t widely followed, at least for some factor relationships, but it deserves to be. Recognizing that a trend may be reversing or accelerating is valuable insight for portfolio design and management.
As an illustration, we’ll review three sets of relative factor trends within the US equities space. The examples below merely scratch the surface – there are numerous risk factors, within and across asset classes, and so the opportunity for digging deeper is wide and deep. But in the interest of brevity, we’ll focus on a trio of the more popular equity factors for the US market. (Note that the charts below show the performance spreads for various pairs of indexes, based on iShares ETFs.)
Equity Market Cap
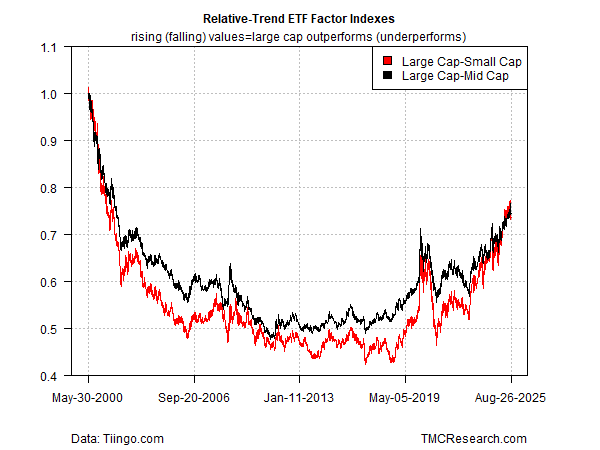
The first chart highlights what is obvious at this late date in the current cycle: large cap stocks continue to lead small- and mid-caps. Rising values in the chart indicate that large cap is outperforming; the opposite is true for falling values, i.e., large cap is trailing. Large cap has been the performance leader since roughly 2019. While it’s easy to assume that this will remain the status quo, it’s important to note that large cap had been trailing for about a decade through 2012 or so. When and if the tide begins to swing back in favor of small- and mid-caps, the evidence will start to emerge in charts such as this. Meantime, a shift doesn’t look imminent for relative-trend behavior.
Growth and Value
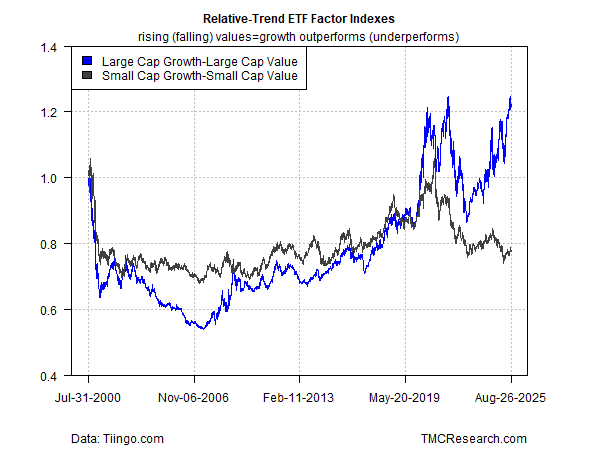
The next chart compares large- and small-cap growth vs. the respective value equivalents. What’s interesting here is the recent divergence between the two spread trends. Large-cap growth’s leadership has rebounded sharply in recent years. By contrast, small-cap growth has lagged small-cap value stocks over the past five-plus years, although recently the trend has been mixed and, to an extent, directionless. In short, the growth/value dynamic tends to be distinct for large cap vs. small cap.
Momentum and Large Cap
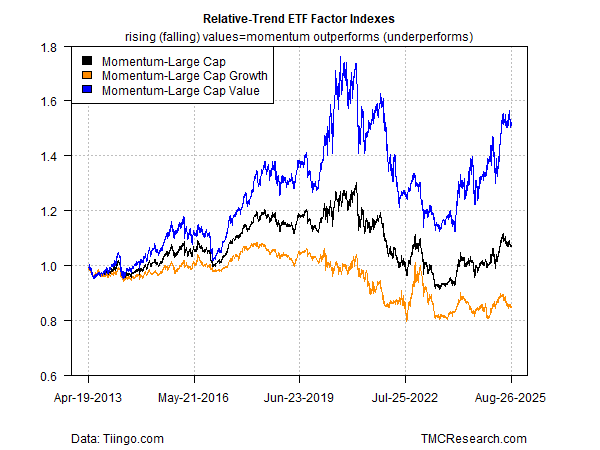
Finally, consider how the momentum factor fares against various slices of large-cap. Here, too, it’s obvious that momentum’s trend cycle can and does vary, sometimes substantially, depending on the definition of the large-cap factor. Relative to large-cap value, momentum’s outperformance in recent history has been strong. By comparison, momentum’s strength vs. large-cap growth has been mixed over the past couple of years.
The lesson in the charts above: analyzing factor trends within and across asset classes can provide insights for portfolio tilting and asset allocation that may not be readily obvious otherwise. Granted, monitoring factor trends isn’t a silver bullet for forecasting equities, and so this type of analysis can deliver muddled results at times. But as a component of a broader risk-analysis toolkit, focusing on risk factors is a valuable, arguably essential, resource.


