
Markets Starting To Price In Stagflation Risk

By James Picerno | The Milwaukee Company
Market proxies are flashing an early warning for inflation
Economy is still expected to grow, but war may strengthen headwinds
Real-time indicators may highlight shifting macro trend ahead of hard economic data
The longer the war drags on, the greater the strain on the economy, keeping energy markets on edge and extending a period of uncertainty. That combination raises the potential risk for higher inflation, slower growth, or both — in other words, stagflation.
For the US, the risk still appears low, based on the data published to date, but a prolonged conflict could turn what was initially expected to be a short-term shock into a persistent headwind. In that scenario, financial conditions could tighten, and the macro outlook may deteriorate rather than stabilize.
Assessing stagflation risk is challenging because the relevant economic data — inflation, payrolls, GDP, and related indicators — are published with a lag and are subject to revision. By contrast, tracking real-time stagflation proxies is useful because markets often register early hints of inflation pressure and growth deterioration well before the official data confirm the shift.
There are many possibilities for estimating stagflation risk, but a practical starting point is monitoring how the market is adjusting interest rates that are sensitive to expectations for the Federal Reserve’s target rate. The Fed left its key rate unchanged at Wednesday’s policy meeting, and the central bank’s revised outlook indicates that policymakers expect rates to remain flat to lower in the near term. Will the bond market agree in the days and weeks ahead?
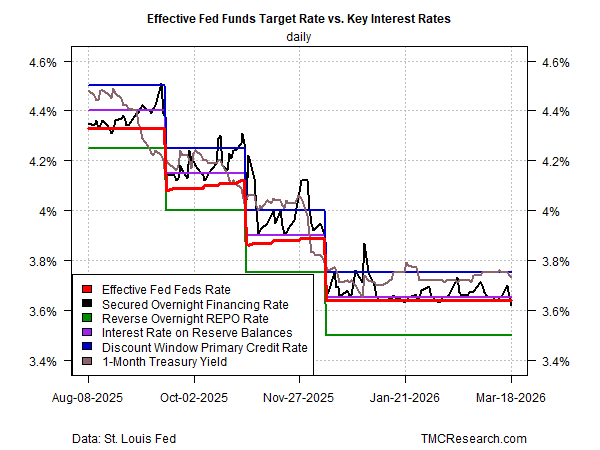
Short-term yields
Market yields on the shorter end of the curve continue to flirt with the possibility that flat-to-higher rates remain on the table. Consider what TMC Research calls the policy channel — yields closely linked to Fed policy expectations. In particular, the 1-year Treasury yield continues to trade in the upper half of the channel, suggesting that a hawkish bias may be poised to influence market sentiment. If the 1-month yield rises above the upper boundary of the channel, currently defined by the 3.75% discount window primary credit rate (blue line), the move would imply that traders are starting to price in higher odds of a rate hike.
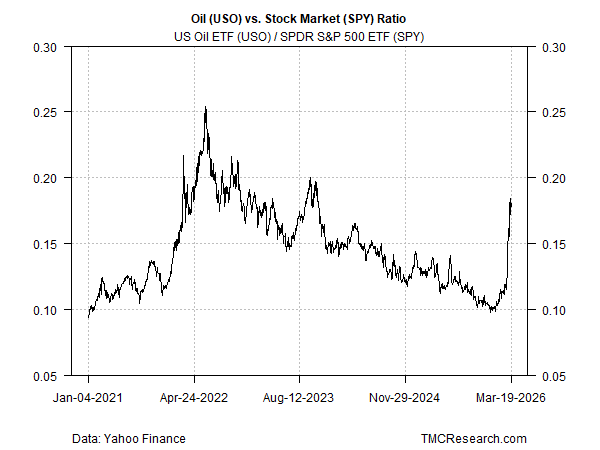
Oil vs. stocks
Estimating stagflation risk is a multidimensional task, but another useful starting point is tracking how crude oil prices move relative to the US stock market. In the chart below, the ratio of two ETF proxies representing these assets is used to illustrate the relationship. The sharp rise lately implies that stagflation risk has likely increased. This is not a flawless indicator; rather, it is valuable for gauging how stagflation risk ebbs and flows. For example, in the second half of 2021 the ratio trended higher before spiking in early 2022, reflecting growing concern that inflation was heating up.
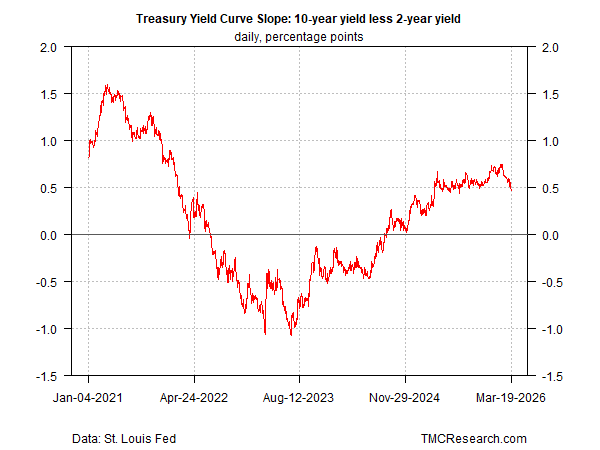
Treasury yield spread
Another useful indicator is the spread between the 10-year Treasury yield and its 2-year counterpart — a market-based proxy for recession risk. A negative spread reflects sentiment pricing in elevated odds of contraction in the near term. At the moment, the spread is still positive and reflecting the recent rebound in economic optimism. Lately, however, the spread has narrowed, and a continued decline in the current environment may signal fading confidence in the growth outlook — especially if the spread slips into negative terrain.
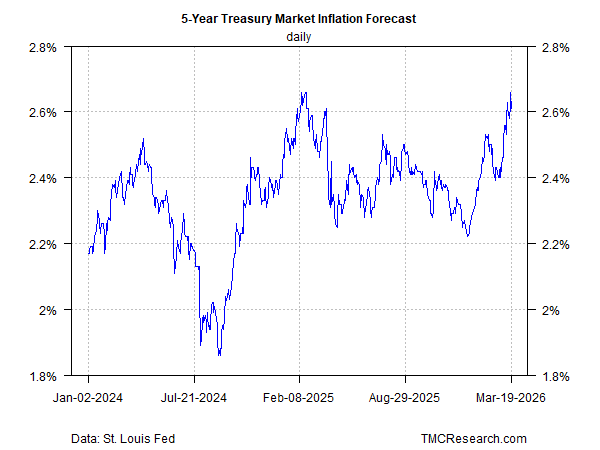
Treasury market inflation forecast
Watching the market’s expectations for inflation is also timely in the current climate. The yield spread between nominal and inflation-indexed Treasuries—the so-called breakeven rate—shows that investors are becoming more concerned. The 5-year spread has rebounded and is near the peak in recent history – 2.66%. A sustained rise higher from current levels would signal heightened concern for the inflation outlook.
Monitoring the Treasury market’s inflation forecast alongside the 10year/2year spread is especially helpful for assessing sentiment around stagflation risk. If the inflation estimate rises while the spread falls (or turns negative), markets would interpret the combination as rising odds of stagflation.
Markets can be wrong, of course, and the indicators above should be viewed with appropriate caution. But as a baseline, these metrics offer a reasonable starting point for evaluating how markets are pricing stagflation risk.
