
Managing Stock Market Return Expectations By Monitoring Return Distributions

By James Picerno | The Milwaukee Company
The average investor is vulnerable to behavioral risk based on recency bias during bull and bear markets.
Comparing the current trailing performance data with its historical interquartile range is a valuable tool for separating noise from signal and making informed forecasts.
Rolling time windows are no panacea, but they offer a solid first step for summarizing current conditions vis-a-vis market history and providing a reality check for managing expectations.
The recent past is a hardy perennial for distorting investor expectations. So-called recency bias is an equal-opportunity offender during bull and bear markets. A useful tool to help keep this type of behavioral risk in check is reviewing how the latest data compares with long-term historical return distributions.
As the boxplot below reminds, any one point in time can reflect a return history that’s either far from, or within, a “normal” range, defined here as the interquartile range (IQR). The gray boxes indicate IQR for the US stock market since 1970 via results from the 25th to the 75th percentiles; the red lines are the 50th percentile, a.k.a. the medians.
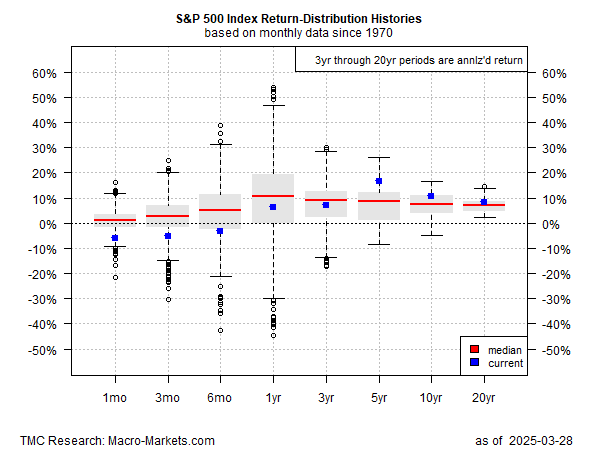
Consider the 1-year return, which at the extremes has ranged from a roughly 54% gain to a 45% loss, based on data since 1970. By definition, data outside the IQR are observed infrequently, and so these numbers represent the outliers. Granted, it’s useful to study extreme market behavior, primarily to prepare for the inevitable anomalies. But a more robust estimate for developing relatively high probability estimates for structuring portfolios is found in the IQR data, which varies for the 1-year return from a fractional loss to a 19.3%, with a median of 10.6%.
To the extent that current return (indicated by the blue squares) moves outside the IQR, the latest data point offers a basis for making a general forecast. For example, the current 5-year return for the S&P 500 is a 16.6% annualized total return, which is well above IQR’s upper range. The implication: managing expectations down for the 5-year outlook looks reasonable.
The future is still uncertain, of course, and so analyzing history comes with all the usual caveats for the task of estimating future returns. But history can be especially misleading when data is taken out of its historical context. Fortunately, viewing the market’s track record through a robust filter (such as comparing recent data with its historical IQR) is an antidote to the hardwired tendency for the average investor to equate the latest market return with compelling estimates for the medium-to-long-term future.
Read a pdf version of this article:
