
Introducing TMC Research’s Recession Probability Indicator

By James Picerno | The Milwaukee Company
Recession risk is rising, but is still low at a 5% probability, per TMC Research’s new indicator
TMC’s recession indicator blends data from 3 business-cycle models published by regional Fed banks
The model offers weekly updates for relatively timely analytics for tracking US economic conditions
Some economists are predicting that US recession risk is rising, and a downturn could arrive before the year is out, but the supporting data to date is still thin.
The recent slowdown in hiring could be an early warning sign, and one that is probably a key factor in motivating markets to estimate a high probability that the Federal Reserve will announce a cut tomorrow (Wed., Sep. 17), according to Fed funds futures.
If the central bank does ease monetary policy, the shift will likely be seen as a pre-emptive move by the Fed to support the economy in an attempt to avoid recession. Monitoring recession risk, as a result, will be in closely monitored on Wall Street in the weeks and months ahead. Estimating this risk, however, can be challenging, in part because the subject is surrounded by a wide array of ad-hoc estimates and speculation in the media. To help separate the signal from the noise, TMC Research is introducing a new metric for monitoring business-cycle conditions in real time, based on three models developed by regional Fed banks.
Let’s start with the indicator’s current reading: The TMC Recession Probability Indicator (RPI) is estimating a low 5% probability that the US economy is currently experiencing a contraction, as defined by the National Bureau of Economic Research, the official arbiter of business-cycle dates.
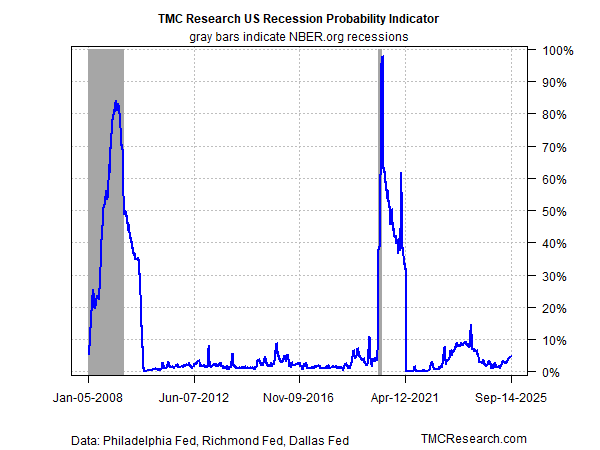
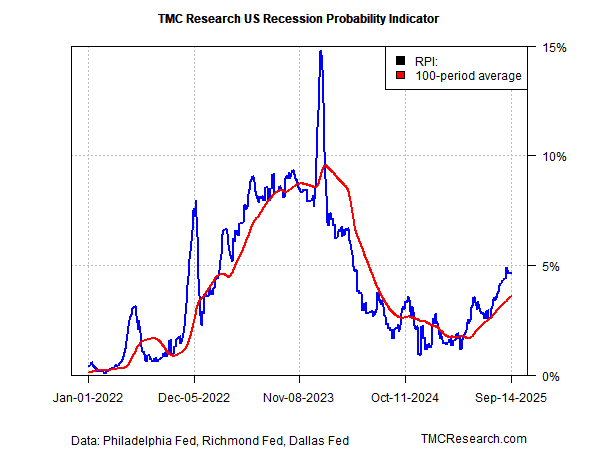
Zooming in on recent history shows that recession risk is rising, albeit from a low base. Yet the current estimate is still well below the near-15% probability briefly reached in early 2024, which was still low by historical standards. The bottom line. As a result, elevated recession risk appears to be a low-probability scenario for the near-term horizon, based on this indicator. (RPI is usually updated weekly, the frequency for one of the inputs varies and is irregular. As a result, RPI is revised daily, although the updates often carry forward previous values that may or may not be revised.)
Combining models
There are numerous indicators that estimate recession risk, so why develop a new business-cycle metric? Several reasons. First, RPI is complimentary to most of the existing modeling efforts because 1) it is a high-frequency indicator (weekly/intra-weekly updates) that 2) averages signaling from three publicly-available, transparent business-cycle indexes that use varied data sets and quantitative models. In short, averaging the implied recession probability estimates from this trio offers a relatively robust, objective approach to recession monitoring on a weekly basis – a modeling approach that’s not widely available otherwise.
At the core of RPI is the recognition that ensemble modeling – using several models rather than just one – has a long history of support in the pursuit of more reliable forecasts compared with using one model in isolation. Although there can be no guarantee that RPI’s estimates going forward will be accurate on a timely basis, TMC Research expects the indicator will be competitive with most, if not all, recession estimates. As an added bonus, RPI will update weekly, offering a more timely read on the state of the economy vs. some popular metrics that are published monthly.
The methodology for generating RPI is based on a probit model to estimate the implied probability of recession for each of the three indicators separately, and then averaging those estimates.
Here's a quick review of each of RPI’s three inputs from regional Fed banks:
Scavette-O'Trakoun-Sahm-style (SOS) indicator, published by the Richmond Fed, which advises: SOS “is a new US recession indicator using the weekly insured unemployment rate with the methodology of the Sahm Recession Indicator (2019). The weekly SOS indicator has been demonstrated to provide accurate and timely signals of recession over the past fifty years, and may complement the signals of other leading recession indicators.”
Aruoba-Diebold-Scotti (ADS) Business Conditions Index, published by the Philadelphia Fed: “The Aruoba-Diebold-Scotti business conditions index is designed to track real business conditions at high observation frequency. Its underlying (seasonally adjusted) economic indicators (weekly initial jobless claims; monthly payroll employment, monthly industrial production, monthly real personal income less transfer payments, monthly real manufacturing and trade sales; and quarterly real GDP) blend high-frequency and low-frequency data. The ADS index on this web page is updated in real time as new or revised data on the index's underlying components are released. Hence at the time of any ADS update, the index is based on all information on all indicators available at that time.”
Weekly Economic Index, published by the Dallas Fed: The Weekly Economic Index (WEI) provides a signal of the state of the US economy based on data available at a daily or weekly frequency. It represents the common component of 10 different daily and weekly series covering consumer behavior, the labor market and production.

Excellent article.