
Estimating Market Risk By Comparing Fundamentals With A Performance Based Indicator

By James Picerno | The Milwaukee Company
Several fundamental indictors point to high valuation for the stock market
A performance-based measure, by contrast, offers a less-worrisome view for the near term
The diverging risk estimates suggest there’s still room for debating the market’s near-term outlook
Among Warren Buffett’s best quotes is the eminently practical: “Be fearful when others are greedy, and greedy when others are fearful.”
The sage advice is a useful lens for thinking about market bubbles, which are notoriously difficult to exploit in real time in terms of timing. The issue isn’t whether bubbles exist—they do. The challenge is knowing when (or whether) it makes sense to get defensive.
There’s no shortage of metrics designed to spot periods when sentiment has outrun fundamentals. But no single indicator is a silver bullet. Every approach to bubble analytics has limitations, which is why it’s better to consult several measures rather than rely on one.
Along the way, it may be best to drop the “bubble” reference altogether. The term carries baggage that can cloud judgment. In practice, saying the market’s in a bubble is often just a sharper way of saying valuations are extreme.
A cleaner framework is to view valuation on a continuum. That won’t suddenly produce reliable timing signals, but it does help draw a line from one extreme to another and compare current conditions with history.
A useful starting point: fundamental valuation measures like the CAPE Ratio (Cyclically Adjusted Price-to-Earnings) or the Buffett Indicator—the stock market’s capitalization relative to US GDP. They’re helpful, but the old Wall Street maxim still applies: markets can stay irrational longer than you can stay liquid.
There are ways to refine signals from CAPE, the Buffett Indicator, and similar measures. Another approach—arguably complementary—is to evaluate markets through a purely performance-based quantitative lens. As always, there are many variations, and investors need a method that fits their objectives, time horizon, and risk tolerance.
As a baseline, consider what TMC Research calls the Excess Return Oscillator (ERO). It compares the S&P 500’s rolling 5-year return to its rolling 5-year median. The results are converted into z-scores, showing how many standard deviations returns are above or below average.
The results for the stock market (S&P 500) via ERO since 1980 are shown below and are suggestive that relatively high readings (near or above +1) reflect excessive market moves that are sometimes associated with near-term tops.
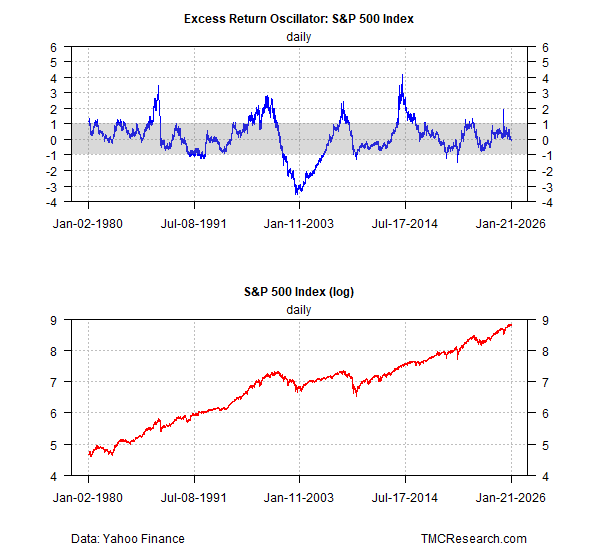
On the flip side, readings near or below -1 suggest excess in the magnitude of market declines—an anti-bubble, so to speak.
To be fair, interpreting these readings in real time requires a mix of art and science—subjectivity that’s far less obvious in hindsight. But as a supplement to CAPE, the Buffett Indicator, and other “bubble” metrics, ERO is a useful addition when assessing if greed, fear or something in between is dominating sentiment.
On that score, ERO’s current reading is more or less neutral, ticking slightly below zero as of Jan. 21. That’s hardly a guarantee that the market will be immune to a correction or worse. Rather, it’s one way of trying to extract a market-based estimate of relative valuation without relying on accounting-based metrics, such as earnings or GDP.
Both approaches are susceptible to various weaknesses and flaws, albeit different ones. And let’s not forget the universal condition: No indicator that attempts to discern market valuation can predict the future.
Regardless of how you crunch the numbers, uncertainty persists. But in the cause of building comparatively robust probabilistic estimates, more inputs from various models can be better.
For now, ERO’s neutral reading serves as a counterpoint to the high—if not extreme—valuations reflected in CAPE and the Buffett Indicator. The divergence suggests valuation risk, although a cautionary signal, may not pose an immediate threat, at least according to ERO.
Over longer horizons, CAPE and the Buffett Indicator still imply that expected returns will be lower than recent history.
A more effective use of ERO may arrive when it aligns with the warnings from CAPE and BI. For now, there’s still room for debate.
